

Telecom and O-RAN Overview
The telecom sensor flavor includes the standard Telovix runtime security capabilities plus 5G, O-RAN, RAN, user-plane, signaling, SLO, and packet-capture evidence. The Console connects protocol observations to the sensor, host, process, container, Kubernetes workload, network function, peer, and selected telecom network when that evidence is available.
Telovix is vendor-neutral. The same telecom workspace is intended for commercial network functions, open-source labs, virtual appliances, containers, Kubernetes, and bare-metal deployments.
Requires: Telecom sensor flavor and the Telecom Console vertical. See Sensor Flavors.
Select the correct telecom network
The Telco navigation header shows the active network scope. Select the network before interpreting topology, SLO, security, or protocol evidence.
When moving between pages, the selected network remains active. Clear it when you need fleet scope. If a view appears empty after a migration or new deployment, verify the network tag and sensor membership first.
Telecom workspace
Open one of four primary workspaces: Network, Sessions, Threats, or Assurance. Each keeps the selected network scope while you move between its views.
| View | Use it to |
|---|---|
| Network > Overview | Review observed topology, network functions, protocol activity, security posture, and current operational signals. |
| Network > Network Functions | Search network functions and inspect process, host, workload, role, peer, and history evidence. |
| Network > RAN | Review gNodeB, UE, NGAP, F1AP, E1AP, XnAP, S1AP, NRPPa, NAS, SCTP, and association evidence. |
| Sessions > User Plane | Inspect PFCP sessions, GTP-U tunnels, GTP control and charging state, TEIDs, forwarding relationships, and visibility gaps. |
| Sessions > 5G Core | Review SBI operations and relationships between core network functions. |
| Network > O-RAN | Investigate RIC, E2 nodes, xApps, rApps, O1/O2 activity, and O-RAN security evidence. |
| Sessions > Protocols | Explore supported RAN, core, O-RAN, SS7, subscriber, media, interworking, and gateway-control observations and coverage. |
| Threats | Triage telecom findings with scope, confidence, provenance, and related runtime evidence. |
| Assurance > Service Levels | Review service levels, resource behavior, energy estimates, and evidence availability by network function. |
| Assurance > Packet Capture | Create bounded per-sensor PCAPNG files for packet-level analysis. |
Read evidence states correctly
Telecom views distinguish an observation from a coverage conclusion:
| State | Meaning |
|---|---|
| Observed | Matching evidence was seen in the selected scope and period. |
| Not observed | No matching evidence was seen. This is not proof that the activity did not occur. |
| Unsupported | The current protocol, application, or traffic path is not decoded. |
| Lost | Capture, state, or delivery loss affected the evidence. |
| Stale | The evidence exists but is older than the view's current operational window. |
| Unavailable | The Console cannot currently retrieve or evaluate the evidence. |
Do not report Not observed, Unsupported, Lost, Stale, or Unavailable as healthy or secure. Open the associated coverage detail before reaching a conclusion.
Observed 5G topology
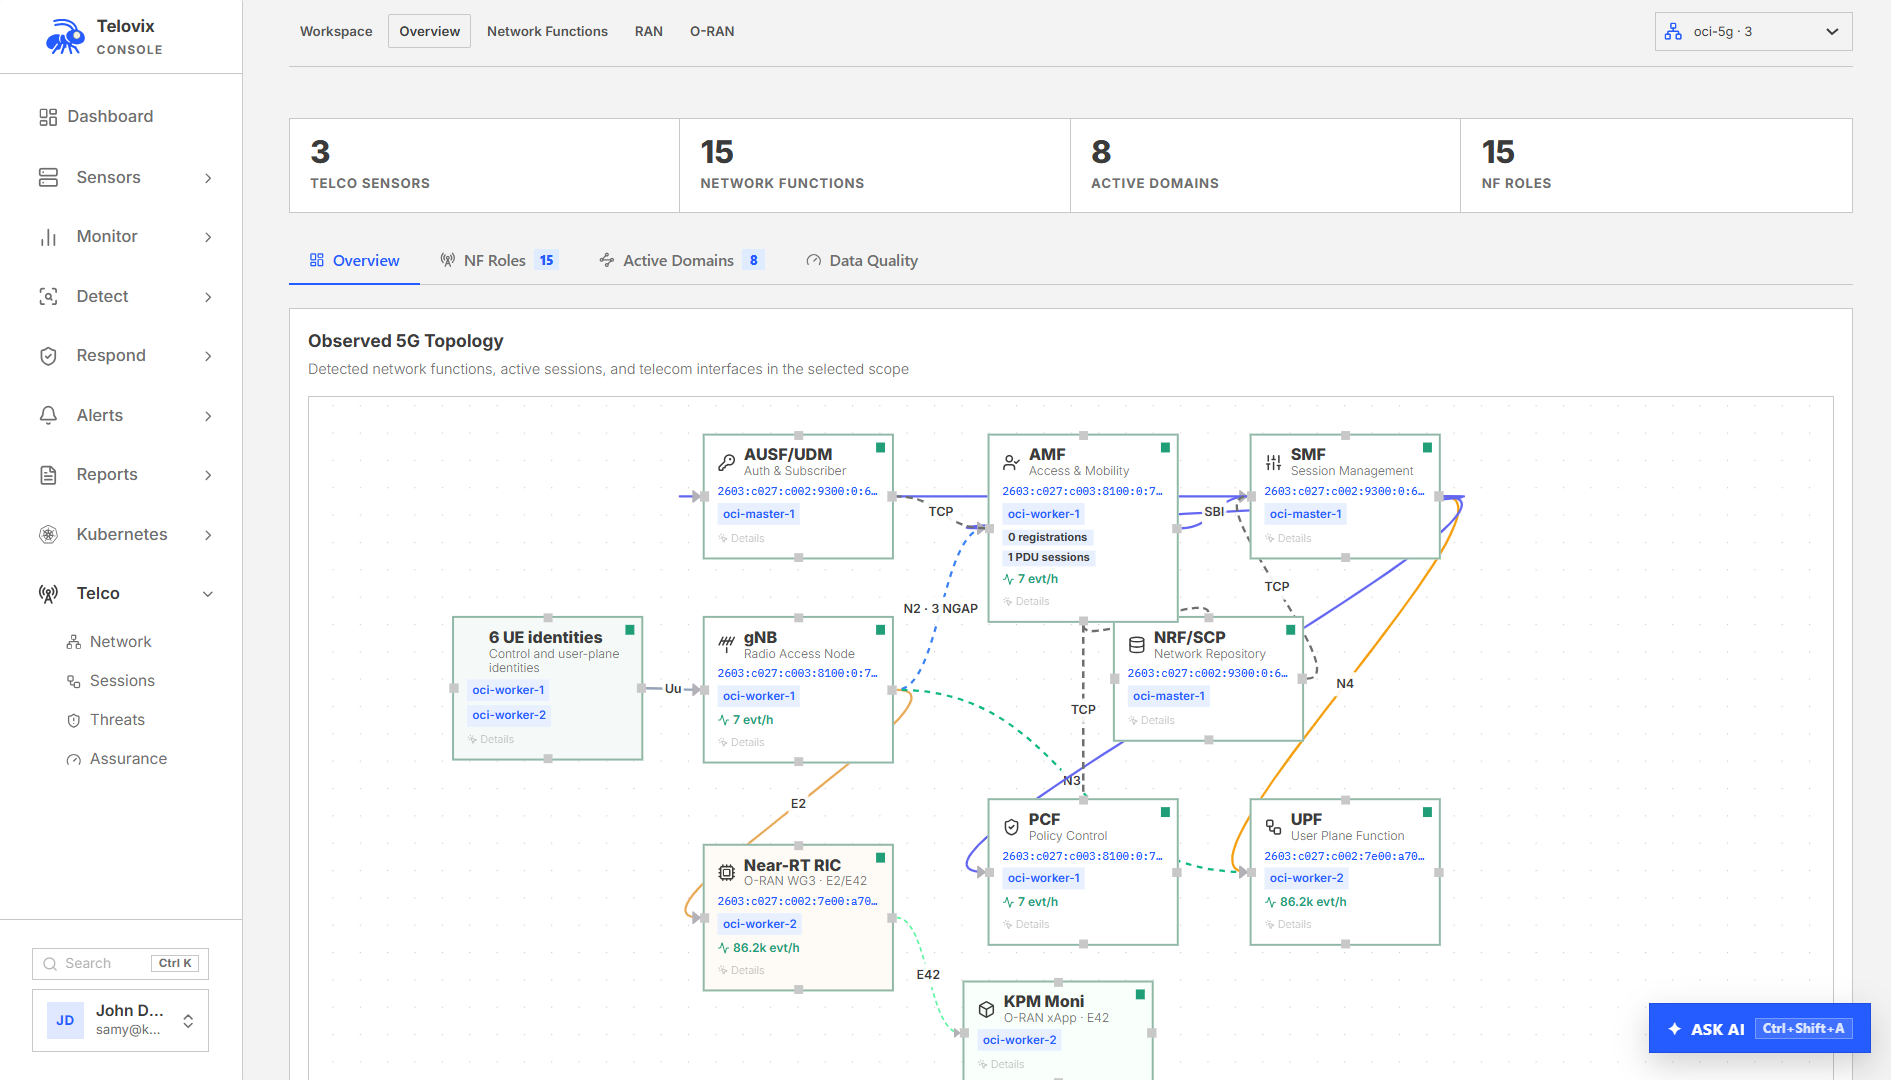
Open Telco > Network > Overview for the Observed 5G Topology. The Network workspace also provides the role-level Observed Telecom Topology. Both use observed relationships rather than an expected architecture template.
Overview builds a relationship map from observed network-function and protocol evidence. Select a node or edge to open the evidence panel and continue to the relevant NF, RAN, user-plane, protocol, sensor, process, or workload view.
Connections after a sensor restart
A verified existing connection can appear separately from a decoded protocol relationship. For example, a dashed TCP (pod) link shows an observed connection between workloads; it does not establish an SBI operation, method, path, response, or latency.
Select the edge to check its source and observation time. A disconnected function means no qualifying relationship is currently available in that scope, not necessarily that the function is offline. New sensor reports can restore existing-connection visibility, while decoded calls require captured traffic.
UEs appear only when Telovix has enough current NGAP or correlated session evidence to represent them. If a connected UE is absent:
- Confirm the selected network and time range.
- Confirm the gNodeB and AMF sensors are healthy.
- Open RAN and check NGAP and SCTP evidence state.
- During an approved test, generate a known registration or PDU-session event.
- Check for unsupported, lost, stale, or unavailable evidence.
- Confirm traffic is not bypassing the observable kernel path.
Telovix does not invent UE, session, tunnel, or peer relationships when the required evidence is incomplete.
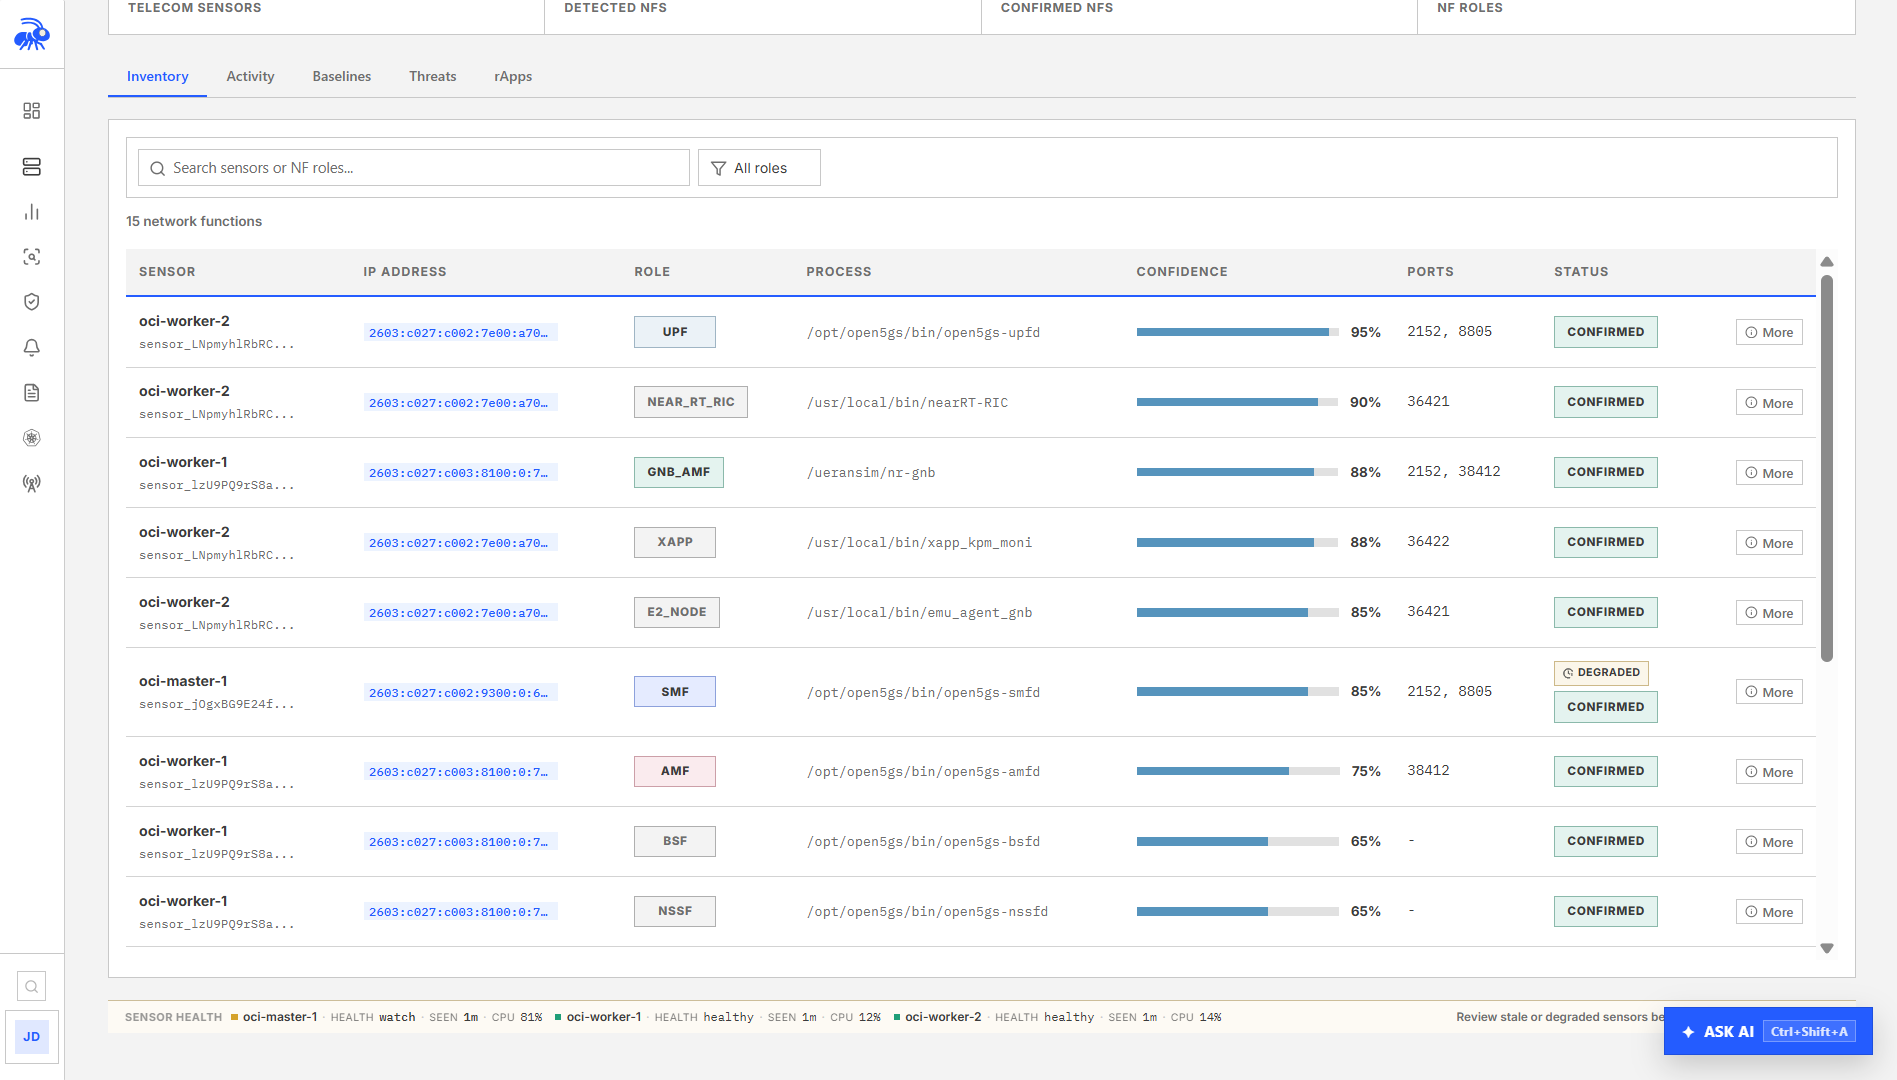
Network-function identity
Network-function details show the best available role and runtime identity. Review confidence and source before relying on an inferred role.
For stable operations:
- assign clear sensor tags such as network, site, and intended role;
- keep node, workload, and process names meaningful;
- select the correct network scope;
- inspect the process and workload evidence when a role is unexpected;
- correct deployment metadata rather than treating a generic fallback as a confirmed NF role.
Role identity improves topology, filtering, SLO grouping, policy targeting, and finding context.
Protocol and session investigations
Start from the interface involved in the incident:
| Question | Start with |
|---|---|
| Why is UE registration failing? | RAN, then NGAP procedure and SCTP association evidence |
| Why is a PDU session incomplete? | RAN, User Plane, and correlated PFCP or GTP-U evidence |
| Which NF called this SBI operation? | 5G Core or API Security |
| Is a user-plane relationship unexpected? | User Plane, then process and sensor evidence |
| Did an O-RAN control or configuration operation occur? | O-RAN, then the selected peer or operation evidence |
| Is a legacy protocol involved? | Sessions > Protocols |
| Is packet-level evidence required? | Assurance > Packet Capture |
Use the right-side evidence panel to pivot to exact sensor, process, Kubernetes workload, network, API, finding, or historical evidence.
Telecom Security
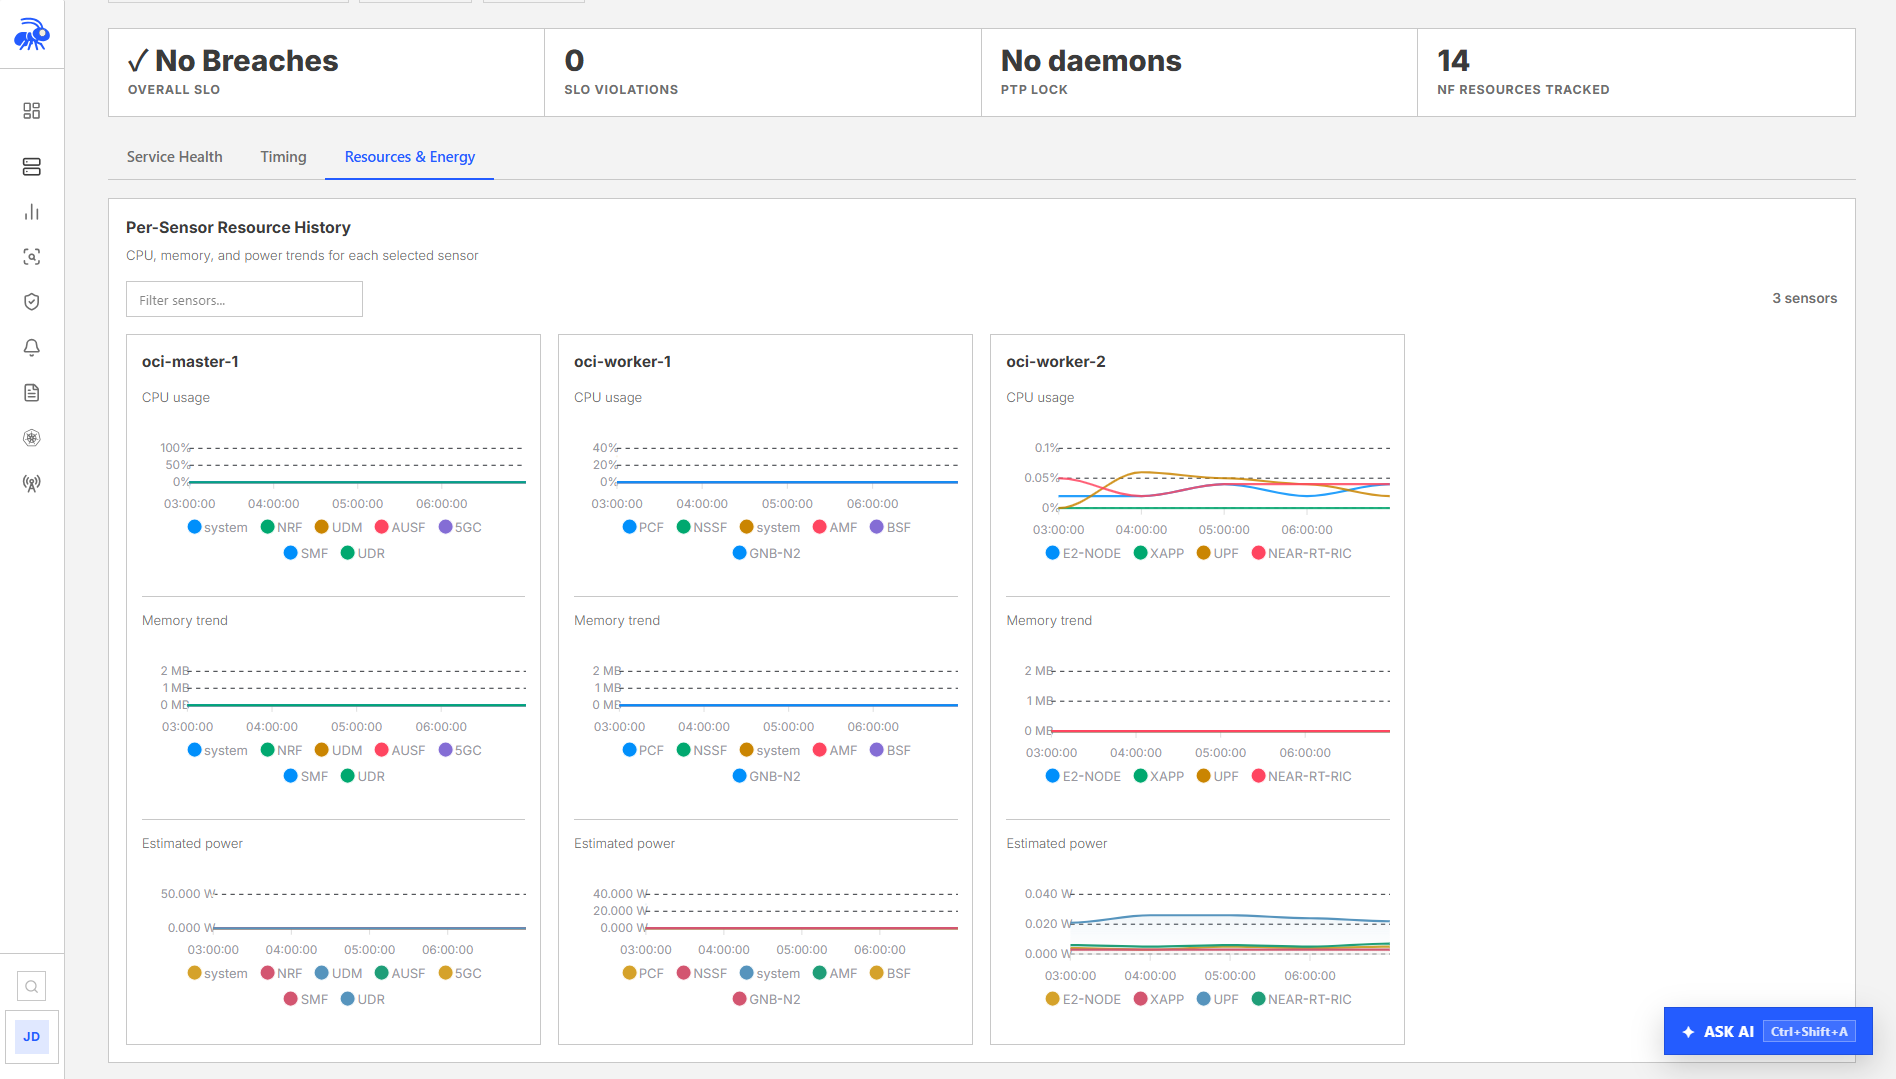
Telecom findings may be based on protocol behavior, peer or role drift, runtime activity, credential access, TLS posture, SLO evidence, or a combination of signals.
Before marking a finding true positive:
- Confirm network, sensor, NF, interface, and time.
- Review confidence and evidence source.
- Inspect the exact protocol or runtime observations.
- Check coverage loss and evidence freshness.
- Confirm whether the result is an observation, anomaly, policy violation, or enforcement outcome.
A heuristic indicator is not automatically proof of compromise.
SLO and resource evidence
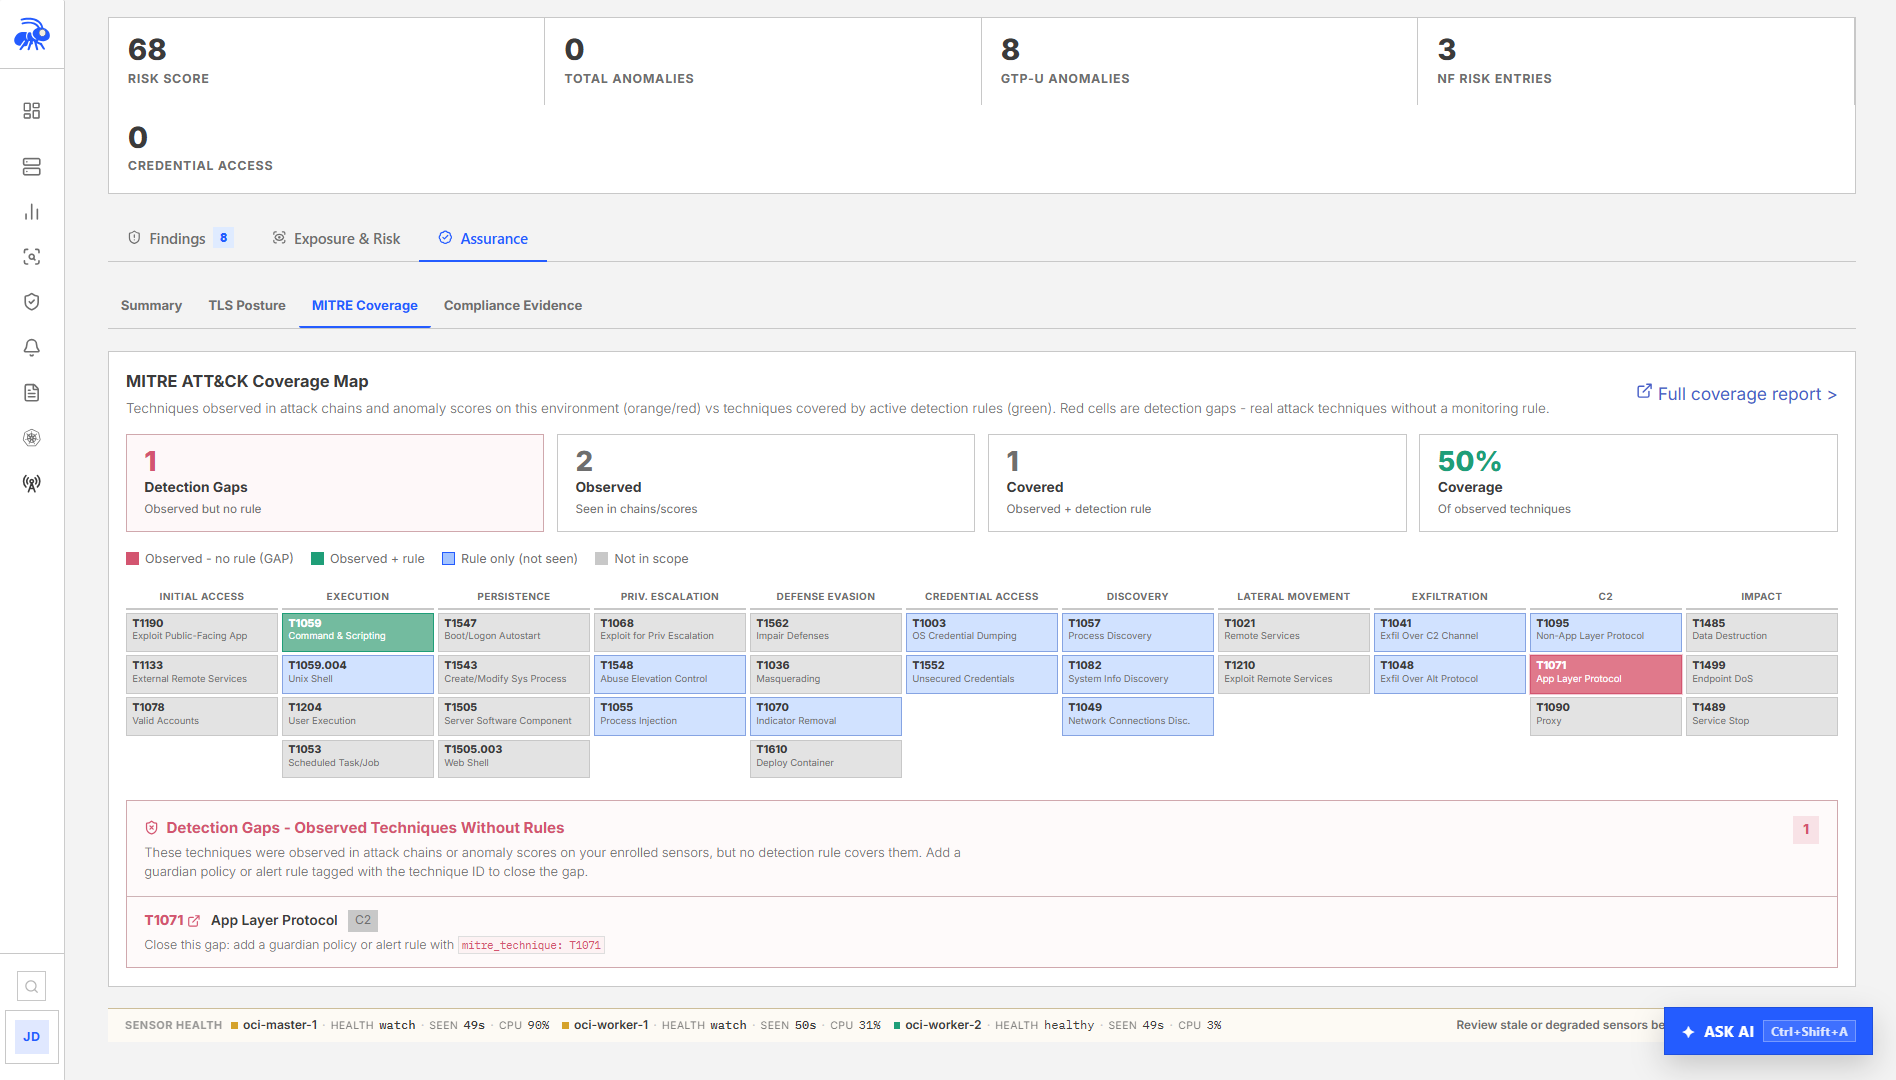
SLO shows current and historical availability, latency, error, CPU, memory, power, and recovery evidence when available for the selected network function.
Power can be measured or estimated depending on the host. The UI labels evidence availability. Use measured power for precise energy accounting and estimates for comparative operational analysis.
Configure service objectives appropriate to the operator and network function. Do not assume a default target represents a contractual SLA.
Packet capture
Use Telco > Assurance > Packet Capture for a focused Diagnostic, Control-plane, or Deep PCAPNG capture on one sensor. Choose the shortest duration that can reproduce the issue, review included interfaces and namespaces, and download only after finalization.
See Telecom Capture for profiles, durations, evidence counters, TLS plaintext, Wireshark use, and troubleshooting.
Kernel-bypass limitations
DPDK, SR-IOV device passthrough, AF_XDP, VFIO, SmartNIC offload, and closed appliances can move traffic outside the normal host path. Telovix reports coverage limitations where it can identify them, but it cannot decode packets it never observes.
When evidence is missing on a user-plane or high-performance RAN node, compare the workload's interface and acceleration configuration with the capture targets before changing protocol filters.
Recommended operational workflow
- Deploy the telecom flavor to the relevant nodes.
- Tag sensors by network, site, and intended role.
- Select the telecom network in the Console.
- Validate network-function inventory and observed topology.
- Generate known signaling and session traffic.
- Confirm RAN, core, user-plane, TLS, and protocol evidence states.
- Establish normal SLO and behavior ranges.
- Investigate findings from exact evidence before enabling enforcement.
- Use a short per-sensor capture when packet-level confirmation is required.