SLO and Resource Monitoring
The telecom sensor tracks NF availability, recovery time, and resource consumption alongside runtime security events. This gives operators a single view that combines protocol health, process behavior, and operational metrics for every monitored network function.
Requires: Telecom sensor flavor.
SLO targets
SLO targets are based on 3GPP TS 22.261 availability requirements. The sensor assigns a target to each NF role automatically at role classification time.
| Tier | Target | Roles |
|---|---|---|
| 5-nines | 99.999% | AMF, UPF, SMF, MME, SGW, PGW |
| 4-nines | 99.99% | NRF, AUSF, UDM, UDR, HSS |
| 3-nines | 99.9% | PCF, CHF, BSF, NSSF, NEF, gNB variants, Near-RT RIC |
| 2-nines | 99.0% | All other roles (DiameterNode, RadiusServer, ImsNode, SigtranGateway, TelecomProcess, etc.) |
For a 5-nines target, the allowed downtime per year is approximately 5 minutes 15 seconds. Breach detection is designed to catch sustained outages, not transient restarts; the minimum observation window of 300 seconds ensures the sensor has enough data before firing.
Availability calculation
The sensor computes availability per role per sensor as:
availability_pct = total_uptime_secs / total_observation_secs * 100.0total_observation_secs: time elapsed since the NF was first observed (or since the sensor enrolled, whichever is shorter)total_uptime_secs: time during the observation window when the NF process was in stable running state (learning window complete)
The SLO calculation begins when on_nf_started fires (NF is stable after the learning window). Downtime begins when on_nf_stopped fires (NF process exited or was terminated). Each restart accumulates as a downtime interval. The ratio is recalculated on every heartbeat.
Breach detection
Breach detection activates after the NF has been observed for at least 300 seconds (5 minutes). Before this threshold, availability data is collected but no breach alert fires.
When availability falls below the role's SLO target:
- The sensor sets
breach_status: "breached"in theslo_reportheartbeat field. - A
SLO_BREACHEDalert fires with the role, current availability percentage, and target. - Breach re-alert is suppressed for 3,600 seconds (1 hour) to prevent alert storms during sustained outages.
When availability recovers above the target:
- The sensor updates
breach_statusto indicate recovery. - A
SLO_RECOVEREDalert fires.
MTTR tracking
Mean Time To Repair is the average delay between an NF process exit and the next successful start of the same role on the same sensor.
- The sensor maintains a sliding window of the last 10 MTTR samples per role.
- Each sample is: time from
on_nf_stoppedto the nexton_nf_startedevent for the same role. - When MTTR exceeds an expected recovery time, an alert fires.
MTTR data is reported in the slo_report heartbeat field alongside availability and restart count:
{
  "role": "SMF",
  "slo_target_pct": 99.999,
  "observed_availability_pct": 99.99,
  "uptime_secs": 86000,
  "mttr_secs": 30,
  "restart_count": 2,
  "breach_status": "breached"
}
Interface latency and timing
The sensor tracks NF response latency per interface using the timing analysis module. Latency is measured as the elapsed time between a request and its response on each protocol interface.
Interfaces tracked: N4 (PFCP), SBI (HTTP/2), N2 (NGAP), F1 (F1AP), E1 (E1AP), Xn (XnAP)
Statistics reported per interface: mean, p50, p95, p99
Latency data appears in the timing_report and interface_sla_report heartbeat fields.
Timing anomalies
| Anomaly | Meaning |
|---|---|
| Sudden latency spike | Potential DDoS or internal resource contention |
| Latency asymmetry (request fast, response slow) | Uplink/downlink imbalance on the interface |
| Per-UE latency variance | Per-bearer QoS misconfiguration or targeted session attack |
Interface SLA reference
| Interface | Protocol | Latency SLA |
|---|---|---|
| N4 | PFCP (SMF to UPF) | Session create < 100ms |
| E2 | E2AP (RAN to Near-RT RIC) | RIC response < 100ms |
| SBI | HTTP/2 | Request < 500ms |
NF resource metrics
The sensor reports per-role resource consumption in every heartbeat. Resource data appears in the nf_resource_report field and is stored in the nf_resource_history ClickHouse table with hourly granularity.
Metrics reported per NF role:
| Metric | Field |
|---|---|
| CPU usage (%) | Per NF role process |
| Memory (RSS, bytes) | Per NF role process |
| Network interface throughput | Per telecom interface (N3, N4) |
| Power estimate (watts) | Per NF role, hourly aggregated |
Resource history enables:
- Comparing resource consumption before and after a policy pack change
- Identifying resource spikes that correlate with security events
- Comparing the same NF role across different sites or clusters
Energy metrics
The sensor reports energy consumption estimates per NF role in the nf_energy_report heartbeat field. Energy metrics are aggregated hourly and stored in nf_resource_history alongside CPU and memory data.
Energy metrics are most useful in multi-site deployments where operators are comparing cost and load across locations or between different RAN component types (O-DU versus CU-CP, for example).
Console views for SLO and resource monitoring
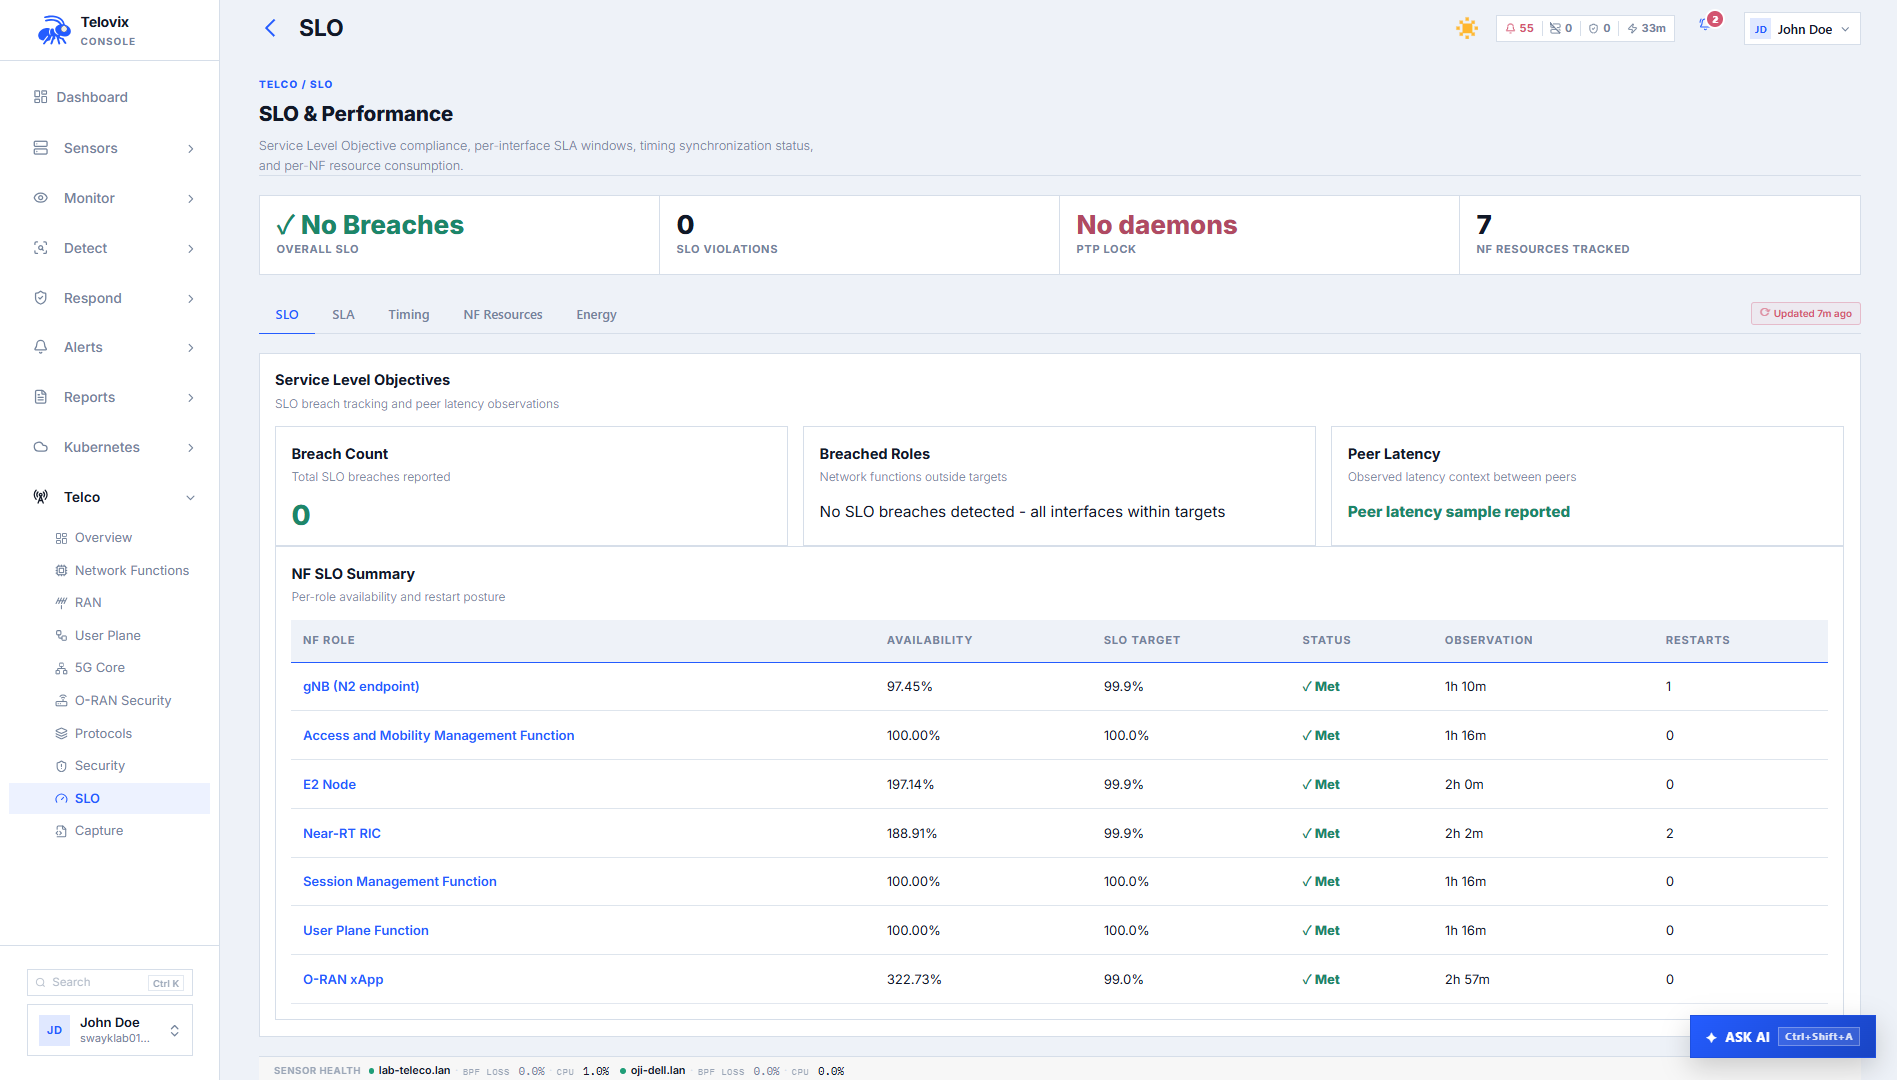
SLO dashboard
In the Console, go to Telco > SLO. The dashboard shows per-NF SLO targets, current observed availability percentages, MTTR values, restart counts, and current breach status across the fleet. Use the sensor and role filters to narrow the view.
AI assistant SLO tool
Ask the AI assistant: "Show SLO status for all UPF nodes."
The AI assistant get_slo_metrics tool queries the slo_report data and returns a summary of availability, MTTR, and breach state per role per sensor.
Telecom overview
In the Console, go to Telco > Overview. This page includes SLO status as part of the full telecom fleet overview alongside NF inventory, protocol KPIs, and risk summary.
SLO data in the heartbeat
The slo_report field in every telecom sensor heartbeat contains the current SLO state snapshot. This is the authoritative source for breach status and availability percentages at any given moment.
Key subfields:
| Field | Meaning |
|---|---|
role_slo_status[] | Array of per-role status records |
slo_target_pct | Configured SLO target for this role |
observed_availability_pct | Current calculated availability |
uptime_secs | Total stable uptime in the observation window |
mttr_secs | Current MTTR average (last 10 samples) |
restart_count | Number of restarts in the observation window |
breach_status | breached, recovering, or healthy |
Sensor tuning for resource-constrained nodes
On nodes with limited memory or high event rates, the eBPF ring buffer size, local spool cap, and SBOM scanning are configurable in Console Settings under the sensor configuration for that node.
Reduce the ring buffer size on nodes where kernel memory is limited. If events are being dropped due to ring buffer overflow, the sensor logs a warning and increments an overflow counter visible in the heartbeat. Reducing the spool cap limits disk usage on nodes with small local storage but increases the risk of event loss during Console outages longer than the spool capacity allows. SBOM scanning can be disabled individually for resource-constrained nodes in Console Settings.
Operational guidance
First-heartbeat SLO: SLO monitoring does not produce meaningful data until the NF has been observed for at least 300 seconds. During initial enrollment or after a sensor restart, SLO availability will show a short observation window. Do not treat a low availability percentage in the first five minutes as a breach indicator.
Role accuracy matters: SLO targets are tied to role classification. A UPF misclassified as generic_linux does not receive a 5-nines SLO target. Declare the node role explicitly during enrollment to ensure correct tier assignment from the first heartbeat.
MTTR window: MTTR is computed from the last 10 recovery samples. A single very long restart skews the MTTR average until 10 subsequent recoveries replace it. On nodes with infrequent restarts, the MTTR window may cover months of history.
Breach suppression and maintenance: The 3,600-second re-alert suppression prevents storm conditions during sustained outages. During planned maintenance (rolling restarts, upgrades), availability will drop below the SLO target and fire a breach alert at the start of the window. The suppression prevents repeated alerts during the maintenance period. The SLO_RECOVERED alert confirms when availability returns above target.
Correlating resource spikes with security events: The nf_resource_report and runtime event stream share the same sensor timestamps. When investigating an anomaly or attack chain, pull both the security events and the resource report for the same time window to determine whether the suspicious behavior coincides with a CPU or memory spike.