Appearance
SIEM Integration
The Telovix Console forwards runtime events from ClickHouse to SIEM destinations on a continuous background loop. Each destination has its own event filter, minimum severity threshold, and cursor position so multiple SIEMs can receive different subsets of events independently.
Prerequisites
adminrole- SIEM destination URL and credentials already obtained
- Console has ClickHouse configured and receiving events
Supported destination types
| Type | Transport | Format | Auth |
|---|---|---|---|
splunk | HTTPS | Splunk HEC JSON | Splunk <token> header |
sentinel | HTTPS | Azure Monitor JSON | HMAC-SHA256 shared key |
elasticsearch | HTTPS | ECS 1.12.0 JSON | ApiKey <token> header |
qradar | UDP or TCP socket | LEEF 2.0 text | None (socket-based) |
observe | HTTPS | Telovix JSON | Bearer <token> header |
huntress | HTTPS | Telovix JSON | Bearer <api_key> header |
sumologic | HTTPS | Telovix JSON | None (URL auth) |
syslog | UDP or TCP socket | RFC5424 or RFC3164 text | None (socket-based) |
How the forwarding loop works
The run_siem_forward_loop background task runs every 15 seconds. On each cycle it:
- Loads all enabled destinations from the database.
- For each destination, fetches up to 100 events per cycle from ClickHouse filtered by the destination's
forward_event_kindsandmin_severity. - Dispatches each event to the destination with a 10-second HTTP timeout.
- Advances the cursor (
last_forwarded_at) after each successful dispatch. - Stops forwarding for the current cycle after 10 consecutive errors on the same destination to avoid overwhelming a degraded endpoint.
The cursor is per-destination and stored in console_siem_forward_cursor. If no cursor exists for a destination (first run or reset), the Console fetches events from the last 900 seconds.
Events are queried from the runtime_events ClickHouse table and forwarded in ascending observed_at order.
Managing SIEM destinations
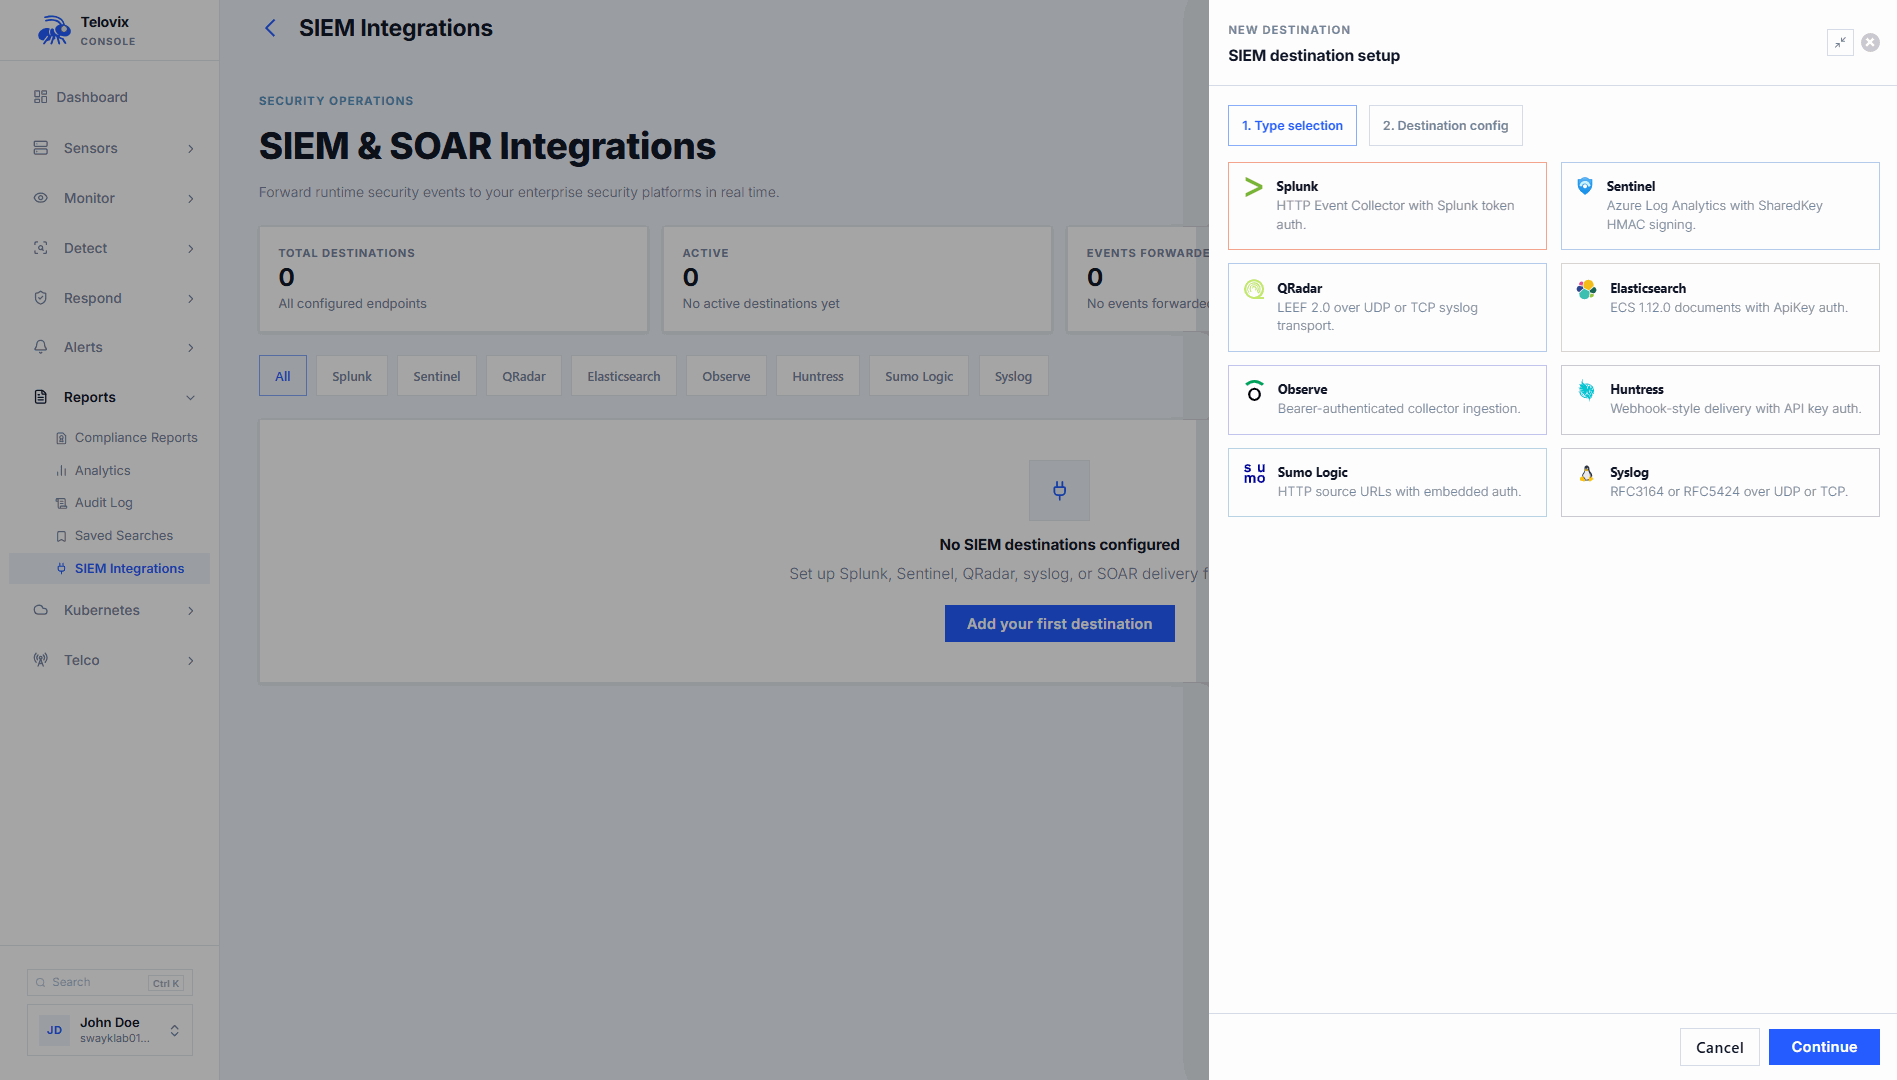
In the Console, go to Settings > Integrations > SIEM to create, update, test, enable, disable, or delete destinations.
Create a destination
In the Console, go to Settings > Integrations > SIEM and click Add Destination. The Console UI presents these fields:
| Field | Required | Description |
|---|---|---|
name | Yes | Display name (max 128 characters) |
destination_type | Yes | One of the 8 supported types |
config | Yes | Destination-specific configuration (see reference below) |
forward_event_kinds | No | Event kinds to forward; leave empty to forward all kinds |
min_severity | No | Minimum severity to forward: low, medium, high, critical (empty = all) |
forward_anomalies | No | Whether to include anomaly score events (default off) |
Update a destination
In the Console, go to Settings > Integrations > SIEM, click the destination row, and edit the fields. Omitted fields retain their current values. To update a sensitive config field (token, key), enter the new value. To keep the existing value, leave the field blank.
Delete a destination
In the Console, go to Settings > Integrations > SIEM, click the destination row, and select Delete.
Test a destination
In the Console, go to Settings > Integrations > SIEM, click the destination row, and click Send Test Event. The Console sends a single test event to the destination and records the result in last_test_ok and last_test_message.
Enable and disable
In the Console, go to Settings > Integrations > SIEM and toggle the enabled state on the destination row. Disabled destinations receive no forwarded events.
Destination configuration reference
The Console UI presents these configuration fields when creating or editing a destination. The JSON structures below show the exact fields the Console expects for each type.
Splunk (HEC)
json
{
  "destination_type": "splunk",
  "config": {
    "url": "https://splunk.example.com:8088/services/collector/event",
    "token": "<hec-token>"
  }
}
Events are posted to the Splunk HTTP Event Collector. Authorization header: Splunk <token>. The payload uses Splunk HEC JSON format with sourcetype: "_json" and source: <event_kind>.
Microsoft Sentinel
json
{
  "destination_type": "sentinel",
  "config": {
    "workspace_id": "<log-analytics-workspace-id>",
    "shared_key": "<primary-or-secondary-key>"
  }
}
Events are posted to https://{workspace_id}.ods.opinsights.azure.com/api/logs?api-version=2016-04-01. Authorization uses HMAC-SHA256 signed with the shared key. The Log-Type header is set to TelovixSecurityEvents.
Elasticsearch / OpenSearch
json
{
  "destination_type": "elasticsearch",
  "config": {
    "url": "https://elastic.example.com:9200",
    "token": "<api-key>",
    "index": "telovix-events"
  }
}
Events are posted to {url}/{index}/_doc. Authorization header: ApiKey <token>. The payload uses Elastic Common Schema (ECS) 1.12.0 format. The index field defaults to telovix-events if omitted. OpenSearch uses the same configuration.
QRadar (LEEF)
json
{
  "destination_type": "qradar",
  "config": {
    "host": "qradar.example.com",
    "port": 514,
    "protocol": "udp"
  }
}
Events are sent as LEEF 2.0 formatted text over UDP or TCP. Default port: 514. Default protocol: udp. Protocol values: udp or tcp.
Observe
json
{
  "destination_type": "observe",
  "config": {
    "url": "https://collect.observeinc.com/v1/http/...",
    "token": "<datastream-token>"
  }
}
Authorization header: Bearer <token>.
Huntress
json
{
  "destination_type": "huntress",
  "config": {
    "url": "https://api.huntress.io/v1/...",
    "api_key": "<api-key>"
  }
}
Authorization header: Bearer <api_key>.
Sumo Logic
json
{
  "destination_type": "sumologic",
  "config": {
    "url": "https://endpoint.collection.us2.sumologic.com/receiver/v1/http/..."
  }
}
No Authorization header. Authentication is embedded in the collector URL.
Syslog
json
{
  "destination_type": "syslog",
  "config": {
    "host": "syslog.example.com",
    "port": 514,
    "protocol": "udp",
    "format": "rfc5424"
  }
}
Default port: 514. Default protocol: udp. Format: rfc5424 (default) or rfc3164. Syslog facility is 1 (user-level messages). Events are serialized as JSON inside the syslog structured data field.
Event fields forwarded
Every SIEM event is built from these fields queried from ClickHouse:
| Field | Description |
|---|---|
event_id | Unique event identifier |
sensor_id | Sensor that generated the event |
node_name | Display name of the sensor node |
event_kind | Runtime event category |
severity | low, medium, high, or critical |
observed_at | When the event was observed (RFC3339) |
message | Human-readable event description |
process_executable | Binary path of the process |
parent_executable | Parent process binary path (optional) |
pid | Process ID (optional) |
uid | User ID (optional) |
k8s_namespace | Kubernetes namespace (optional) |
pod_name | Kubernetes pod name (optional) |
workload_name | Kubernetes workload name (optional) |
dns_hostname | DNS hostname from DNS events (optional) |
args | Process arguments (optional) |
Telovix JSON payload (used by Observe, Huntress, Sumo Logic)
json
{
  "@timestamp": "2026-04-26T14:22:00Z",
  "telovix": {
    "event_id": "...",
    "sensor_id": "...",
    "node_name": "upf-prod-01",
    "event_kind": "privilege_change",
    "severity": "high",
    "message": "...",
    "process": {
      "executable": "/opt/open5gs/bin/upf",
      "pid": 1234,
      "uid": 1000
    }
  }
}
Kubernetes fields (kubernetes.namespace, kubernetes.pod, kubernetes.workload) are included when present.
ECS payload (Elasticsearch)
json
{
  "@timestamp": "2026-04-26T14:22:00Z",
  "ecs": { "version": "1.12.0" },
  "agent": { "name": "telovix-sensor", "type": "telovix", "version": "1.0" },
  "event": { "kind": "event", "category": ["process"], "type": ["start"], "dataset": "process_exec", "severity": 3 },
  "host": { "name": "upf-prod-01", "id": "{sensor_id}" },
  "process": { "executable": "/opt/open5gs/bin/upf", "pid": 1234 },
  "message": "...",
  "telovix": { "event_id": "...", "sensor_id": "..." }
}
ECS severity mapping: critical=4, high=3, medium=2, low=1.
Destination status fields
The destination detail view in Settings > Integrations > SIEM includes these health tracking fields:
| Field | Description |
|---|---|
last_test_at | Timestamp of the last test delivery |
last_test_ok | Whether the last test succeeded |
last_test_message | Result message from the last test |
last_forwarded_at | Timestamp of the last successful event forwarding |
total_forwarded | Total events forwarded since the destination was created |
total_errors | Total forwarding errors since the destination was created |
Operational guidance
Filter by event kind: If you do not filter by forward_event_kinds, all event kinds are forwarded. This includes informational events such as process_exec and network_connect at high volume. Start with a narrow filter covering your highest-value event kinds (fim_alert, privilege_change, module_load, bpf_tampering) and expand as needed.
Sensitive config protection: Tokens, shared keys, and API keys are masked in all read views. When updating a destination config, leave sensitive fields blank to keep the existing values.
Error threshold: If a destination endpoint returns errors consistently, the forwarding loop stops attempting the destination for that cycle after 10 errors and logs a warning. On the next loop tick (15 seconds later) it will try again. If the endpoint is persistently unavailable, events accumulate a growing lag behind the cursor. Events from before the cursor position are not re-queued after the cursor advances.
QRadar and Syslog on non-standard ports: Both use port: 514 as default. Change this to match your QRadar log source or syslog collector's configured port. UDP is the default protocol; use TCP for guaranteed delivery on high-priority events.
Sentinel table naming: Events land in the table named TelovixSecurityEvents in your Log Analytics workspace. Use this name when writing KQL queries or Sentinel analytics rules.