Appearance
Runtime Blocks: Custom Detection Rules
Custom detection rules add targeted kernel-level detections to sensors without modifying a policy pack. The Console provides two authoring paths: a visual builder for common patterns and a raw YAML editor for full TracingPolicy control. The Console delivers rules to sensors via the heartbeat response within 15 seconds of being created or updated.
Prerequisites
operatorrole- Sensor already enrolled and healthy
- Console setup complete
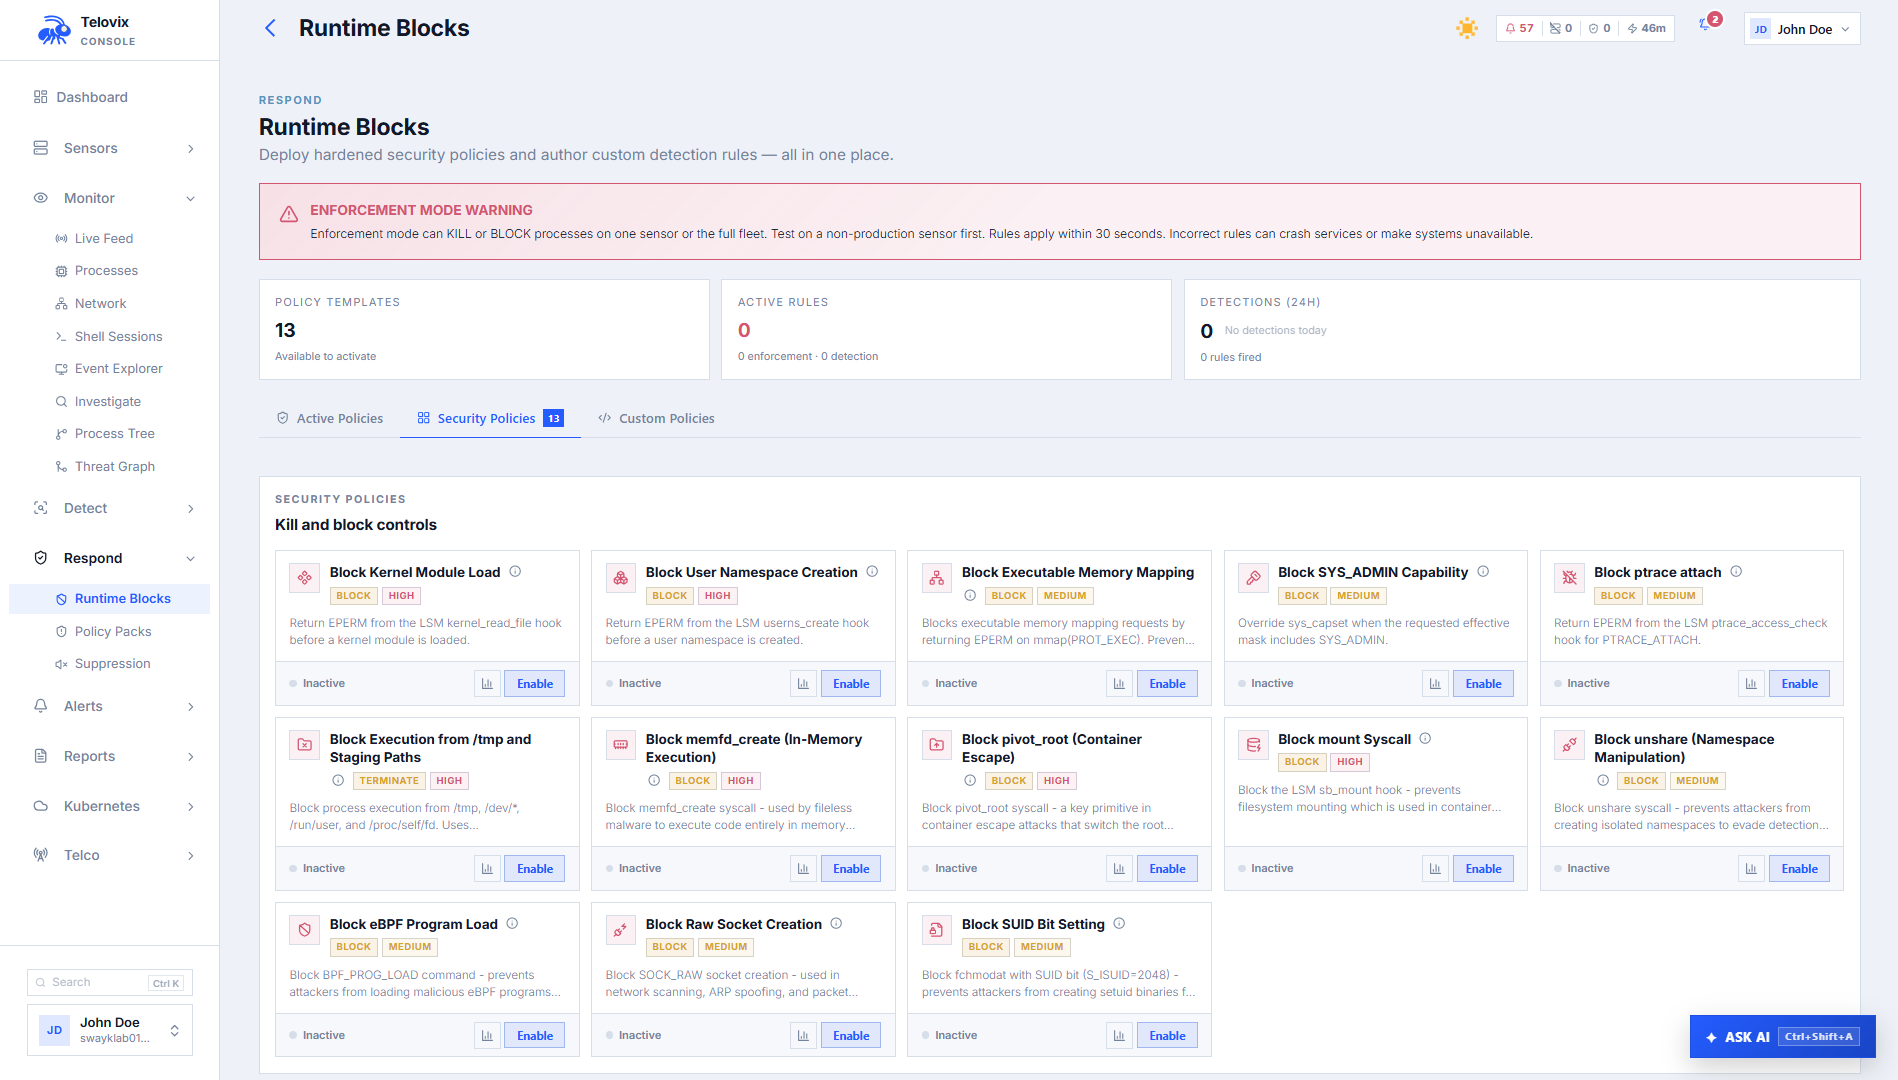
There are two distinct detection rule systems in the Console:
- Custom TracingPolicy rules: kernel-level rules that attach eBPF hooks on the sensor. Up to 10 per Console.
- Custom flags (SQL alerts): event-history queries that fire when patterns in ClickHouse match defined criteria. No sensor-side hook required.
Custom TracingPolicy rules
TracingPolicy rules deploy eBPF programs to sensors. They are the same mechanism as built-in enforcement templates but with operator-authored logic.
Visual Builder
The visual builder offers five preset templates as starting points. Select a template, fill in the parameters, and the Console generates the TracingPolicy YAML:
| Template | Hook | What it detects |
|---|---|---|
| File Access | kprobe: openat | A process opens a file matching a path prefix |
| Shell Escape | kprobe: execve | A watched binary spawns a child process matching a pattern |
| Network Egress | kprobe: connect | A watched process connects to a specific destination prefix |
| Privilege Escalation | kprobe: setuid | setuid, setgid, and capability changes |
| LSM Hook | lsm: any hook | Observation or blocking at a kernel security decision point |
After selecting a template and filling in the parameters, the Console generates YAML that you can review, edit, or switch to the YAML editor for full control.
YAML Editor
The YAML editor accepts any valid TracingPolicy YAML. Constraints enforced by the Console validation endpoint:
- The policy must declare
apiVersion: cilium.io/v1alpha1andkind: TracingPolicy metadata.namemust start withtelovix-custom-spec.kprobesorspec.lsmhooksmust be present and non-empty- Do not mix
kprobesandlsmhooksin one policy - If
lsmhooksusesmatchArgs, it must also have anargsarray
Maximum YAML size: 16 KB. Maximum rules per Console: 10.
Deploy step
When saving a rule, the Console shows a deployment confirmation step where you can set:
- Scope: all sensors (default) or a specific sensor
- Exceptions: a list of process patterns with reasons to exclude from the rule. Each exception has a
process_pattern(glob) and areasonfor the audit trail.
Rule summary fields
Each rule record includes:
| Field | Description |
|---|---|
rule_id | Stable identifier |
name | Human-readable label |
description | Optional explanation |
sensor_id | Specific sensor if scoped, null if fleet-wide |
rule_yaml | Current YAML |
rule_history | Previous versions (saved_at, saved_by, rule_yaml) |
template_id | Visual builder template or empty if raw YAML |
template_params | Serialized visual builder parameters |
enabled | Whether the rule is active |
created_by, created_at, updated_at | Audit metadata |
hits_24h | Count of events matching this rule in the last 24 hours |
confirmations | Which sensors have loaded the rule (sensor_id, node_name, confirmed_at) |
Managing TracingPolicy rules
In the Console, go to Policies > Custom Rules to list, create, update, enable, disable, or delete TracingPolicy rules. Each rule displays hits_24h and confirmations so you can confirm the rule is loading and matching on the intended sensors.
Custom flags (SQL alert rules)
Custom flags query the event history in ClickHouse and fire when the query results meet a defined threshold. Unlike TracingPolicy rules, they do not deploy anything to sensors. They run as background queries on stored events.
Fields
| Field | Allowed values | Default | Description |
|---|---|---|---|
name | (required) | Rule label | |
flag_type | red_flag, ops_flag | red_flag | Security alert or operational signal |
schema | process, network, security, integrity, syscall, evasion, c2, discovery, exfil, persistence, any | any | Event category |
severity | critical, high, warning, info | warning | Alert severity |
query | SQL WHERE clause | (required) | Filter applied to ClickHouse events |
rule_kind | filter, count_threshold, sequence | filter | How the query is evaluated |
rule_spec | JSON object | Additional parameters for count_threshold and sequence | |
response_action | none, webhook, investigate, webhook_and_investigate | none | What happens when the rule fires |
response_webhook_id | Webhook to call (required when response_action includes webhook) | ||
compliance_tags | string array | Link this rule to compliance controls |
Rule kinds
filter: fires when any event matches the query.
json
{
  "name": "Bash from any NF process",
  "flag_type": "red_flag",
  "schema": "process",
  "severity": "high",
  "query": "event_kind = 'process_exec' AND process_executable LIKE '%bash%' AND nf_role IS NOT NULL",
  "rule_kind": "filter",
  "response_action": "investigate"
}count_threshold: fires when the event count exceeds a threshold within a window.
rule_spec must include count_gt (1–10000), window_secs (10–3600), and group_by (one of: process_executable, sensor_id, event_kind, parent_executable, uid).
json
{
  "name": "High exec frequency from single binary",
  "flag_type": "red_flag",
  "schema": "process",
  "severity": "warning",
  "query": "event_kind = 'process_exec'",
  "rule_kind": "count_threshold",
  "rule_spec": "{\"count_gt\": 50, \"window_secs\": 300, \"group_by\": \"process_executable\"}"
}sequence: fires when events match a two-step sequence within a window.
rule_spec must include steps (array of 1 or 2 SQL conditions) and window_secs (10–3600). Optional group_by.
json
{
  "name": "Credential file open followed by DNS from same binary",
  "flag_type": "red_flag",
  "schema": "exfil",
  "severity": "high",
  "query": "sensor_id IS NOT NULL",
  "rule_kind": "sequence",
  "rule_spec": "{\"steps\": [\"event_kind = 'file_open' AND process_executable LIKE '%ssh%'\", \"event_kind = 'dns_query'\"], \"window_secs\": 60, \"group_by\": \"process_executable\"}"
}
Managing custom flags
In the Console, go to Policies > Custom Flags to list, create, and delete custom flag rules. Use the Recent Matches view on each flag to review events that triggered it.
When to use each type
| Situation | Use |
|---|---|
| Detect a kernel-level behavior in real time | TracingPolicy custom rule |
| Enforce or block a kernel operation (kill/override) | TracingPolicy custom rule with Signal or Override action |
| Alert on patterns in historical event data | Custom flag |
| Count how many times a binary runs per minute | Custom flag with count_threshold |
| Alert when a file open is followed by a network event | Custom flag with sequence |
| Alert on any event matching a simple filter | Custom flag with filter |
Recommended workflow
- Start TracingPolicy rules with
action: Post(observe-only). Reviewhits_24handconfirmationsto confirm the rule is loading and matching. - For custom flags, test the SQL query in the Events search view before creating the rule to confirm it returns the expected events.
- When advancing TracingPolicy to
SignalorOverride, use the enforcement impact preview to quantify the blast radius first. - Set
compliance_tagson flags that map to specific compliance controls so they appear in evidence reports.
::: note TracingPolicy rules are not a replacement for built-in packs. Use packs for baseline role coverage, custom rules for targeted patterns that the packs do not cover. :::
Limitations
- Maximum 10 TracingPolicy rules per Console: Across all sensors and groups, the Console enforces a hard limit of 10 active TracingPolicy custom rules. This limit exists because each rule generates a compiled BPF object that must be loaded on every sensor in scope. Plan rule usage accordingly and delete unused rules before creating new ones.
- TracingPolicy YAML size limit is 16 KB: Individual TracingPolicy YAML files cannot exceed 16 KB. Policies that require many selectors should be split across multiple rules, staying within the 10-rule limit.
- Custom flags do not produce real-time events: Custom flag rules evaluate against historical event data in ClickHouse on a periodic schedule. They do not fire synchronously when an event occurs. The latency between an event occurring and a custom flag alert appearing in the Console depends on the evaluation interval.
- TracingPolicy rules apply to all sensors in scope simultaneously: When a rule targets the entire fleet, it is delivered to every enrolled sensor on the next heartbeat. There is no per-sensor rollout mechanism for custom rules. Test on a single sensor first by scoping the rule to a specific
sensor_idbefore removing the scope restriction. - SQL
sequencekind requires events within the same window: For sequence rules, both conditions must occur within the samewindow_secswindow and must be grouped by the same entity (process, sensor, or event kind). Events that span multiple grouping contexts do not trigger a sequence match. - Custom flags are not a substitute for TracingPolicy for real-time enforcement: Custom flags cannot trigger
SignalorOverrideenforcement actions. Only TracingPolicy rules with explicit action types can block or kill at the kernel level.