What Is Telovix?
Telovix is an eBPF security platform built for telecom and Open RAN environments. It gives operators continuous runtime visibility and control over protected nodes through a private Console and node-level Sensors deployed on each host.
Telovix is available in two deployment models:
- Telovix self-hosted: the customer installs and operates the Console and databases on their own infrastructure. All data stays inside the customer network. The customer downloads a signed license bundle from the Telovix Portal and imports it during the Console setup wizard. The Console validates it offline with no internet connection required at runtime.
- Telovix Cloud: Telovix provisions and operates the full platform including the Console, PostgreSQL, and ClickHouse in Telovix's cloud infrastructure. Licensing is injected automatically during provisioning. The customer never imports a license file and reaches the login page directly after provisioning completes.
Both models start with a subscription through the Telovix Portal. You can chooses whether to deploy Telovix self-hosted or request Telovix Cloud from the Portal.
Who it's for
| Audience | What they use Telovix for |
|---|---|
| SOC and incident response teams | Review alerts, investigate runtime behavior, and determine whether an event is node-local or fleet-wide. |
| RAN and core platform engineers | Monitor Linux hosts, 5G Core network functions, and Open RAN nodes at the kernel level. |
| Security architects | Define sensor enrollment, mTLS trust, policy rollout, and enforcement approval paths. |
| Compliance teams | Collect evidence for CIS v8, NIS2, 3GPP TS 33.117, and O-RAN WG11 security requirements. |
| Telecom operators | Correlate kernel-level runtime activity with 5G Core and O-RAN roles and protocol flows. |
How it works
Telovix uses a two-component model: the Telovix Console and the Telovix Sensor.
The Console is the private control plane. It runs as a single Rust binary on a dedicated host or as a Telovix Cloud deployment. It exposes port 15483 (Telovix self-hosted default) for both the operator web UI and the sensor mTLS endpoint on a single combined TLS listener. Every sensor authenticates with a per-node client certificate issued at enrollment. Operators use the Console for fleet management, sensor enrollment, policy pack assignment, alert triage, compliance reporting, and investigations.
The Sensor runs on each protected node as a single Rust binary of approximately 89 MB with an embedded eBPF engine. It deploys as a systemd service, sends a heartbeat every 15 seconds over mTLS to the Console, and maintains a persistent WebSocket stream for low-latency event delivery. If the Console is unreachable, the Sensor spools events to local disk and replays them on reconnect.
The Sensor comes in two flavors:
- Standard: core eBPF security collection only.
- Telecom: everything in standard, plus 5G Core and O-RAN NF monitoring, protocol parsing, NGAP KPI tracking, and telecom security analysis.
Every node starts in observe-only mode. Enforcement requires explicit operator approval.
Console: https://<console-host>:15483 (Telovix self-hosted default)
Sensor heartbeat: every 15 seconds (outbound from sensor over mTLS)
Event stream: persistent WebSocket (500 ms tick, low-latency path)
License model (Telovix self-hosted): Ed25519-signed bundle, validated offline
License model (Telovix Cloud): auto-injected at provisioning, no import needed
::: note Deploy in the order the platform is designed for: observe first, let behavioral baselines build for at least 14 days, validate normal behavior, then move selected nodes to enforcement only after the approval path is confirmed. :::
Architecture overview
Sensors initiate all network paths outbound to the Console over mTLS on port 15483 (Telovix self-hosted default). The Console stores fleet state, alerts, compliance data, and investigations in PostgreSQL and runtime events in ClickHouse, both of which stay inside the deployment boundary. In Telovix self-hosted deployments, the Portal has no runtime link to the Console after license import. In Telovix Cloud deployments, Telovix manages the full lifecycle including license delivery and infrastructure operations.
Deployment models
| Model | Console operated by | Databases | Data residency | License |
|---|---|---|---|---|
| Telovix self-hosted | Customer | Customer-managed | Customer infrastructure | Downloaded from Portal, imported manually |
| Telovix Cloud | Telovix | Telovix-managed | Telovix cloud infrastructure | Auto-injected at provisioning |
Both models are available on the same subscription plans. The choice is made per deployment after the workspace is activated.
Sensor flavors
| Flavor | What it covers |
|---|---|
standard | Process execution, file access, network connections, privilege changes, namespace creation, kernel module loads, ptrace, FIM, SBOM, Kubernetes workload visibility, behavioral anomaly scoring. |
telecom | Everything in standard, plus: 5G Core NF detection and role classification (AMF, SMF, UPF, PCF, NRF, AUSF, and more), O-RAN node detection (O-DU, O-CU-CP, O-CU-UP, near-RT RIC), NGAP/F1AP/E1AP/XnAP/E2AP/PFCP/GTP-U/SCTP/Diameter/RADIUS/SIP/SBI-HTTP2/NAS5G protocol parsing, NF SLO monitoring, TLS uprobe visibility, O-RAN WG11 security checks, and telecom-specific attack chain detection. |
What operators get
| Need | What Telovix provides |
|---|---|
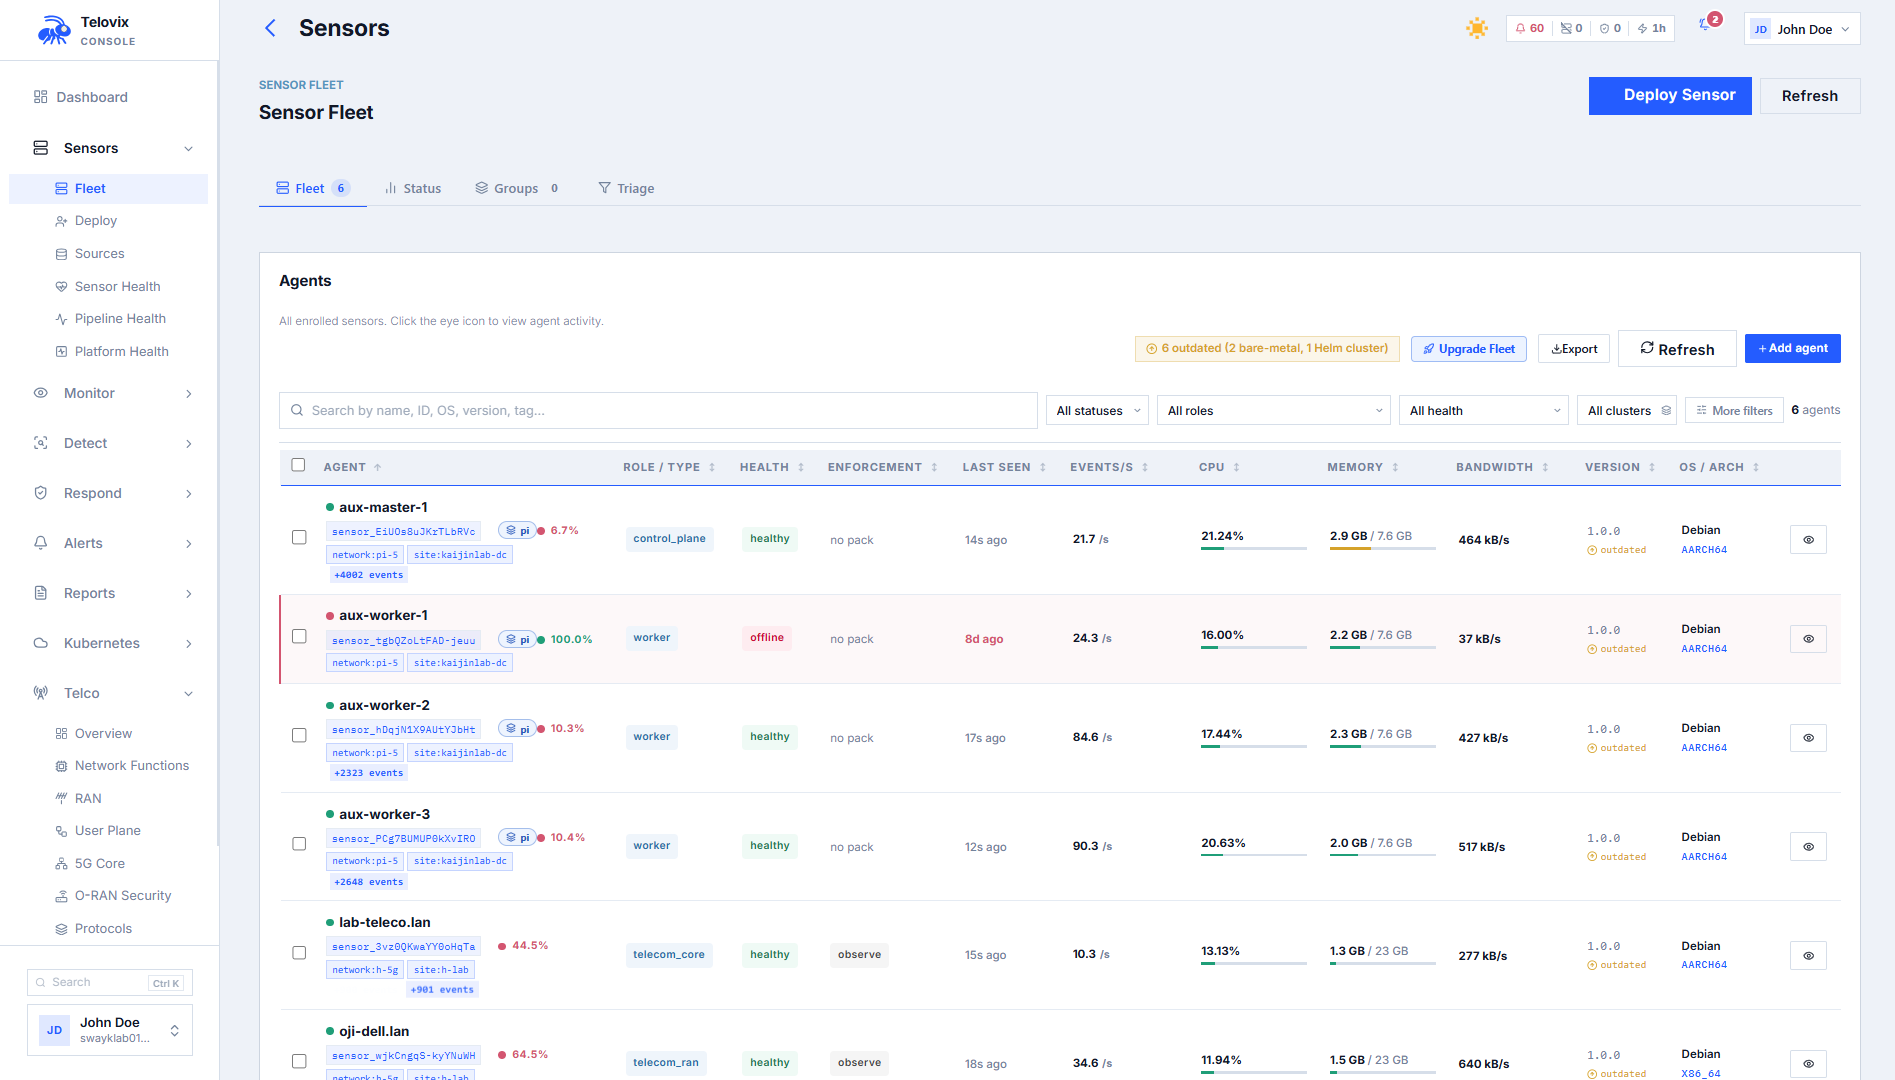
| Fleet state and coverage | Sensor enrollment, health states, trust certificates, heartbeat monitoring, and sensor groups. |
| Runtime behavior detection | Process execution, file writes, network flows, privilege escalation, shell sessions, and kernel-level LSM hooks. |
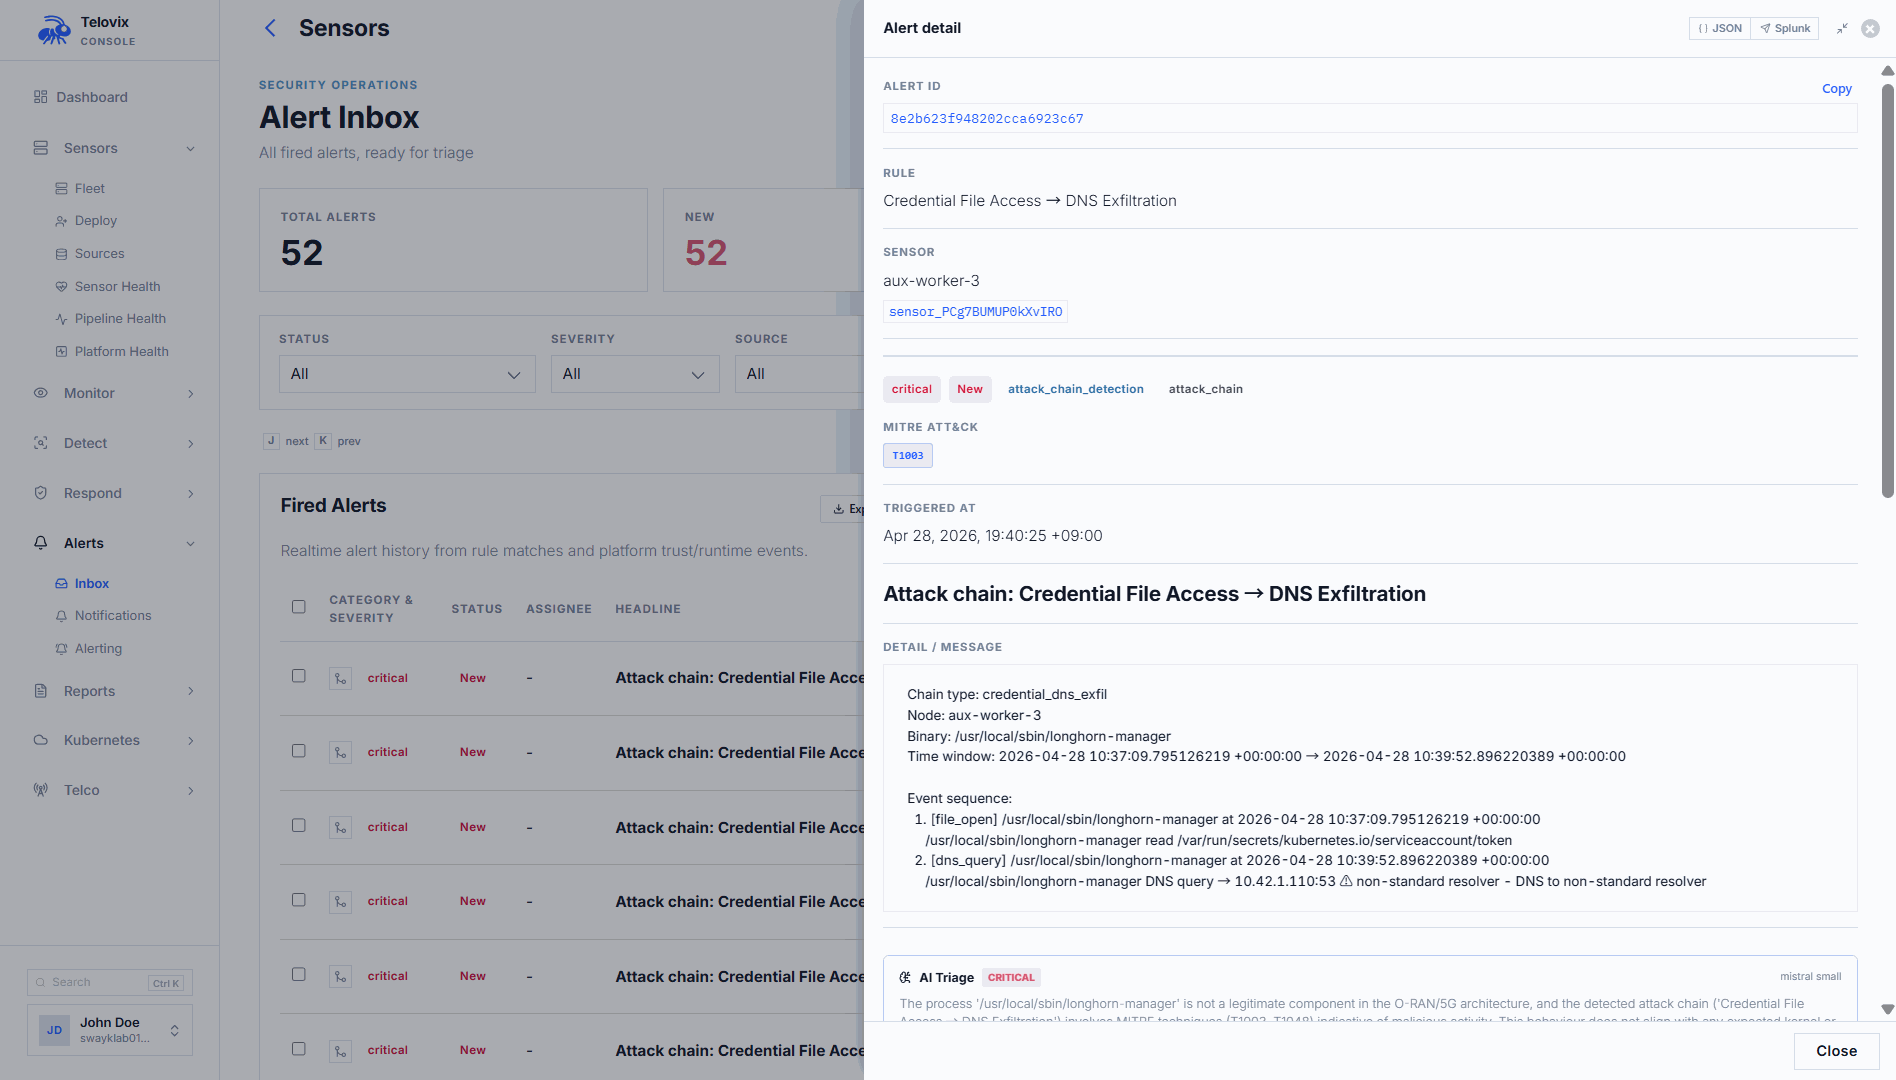
| Alert triage and investigation | Alert inbox with severity scoring, attack chain correlation, process tree, and investigation case management. |
| Behavioral analytics | Per-binary behavioral baselines, anomaly scoring, and 14-day learning mode before alerting activates. |
| Software and dependency visibility | SBOM scanning via Trivy on container images reported by sensors, with CVE tracking. |
| Telecom protocol and NF context | Dedicated Telco section in the Console with 5G Core, O-RAN, RAN, user plane, SLO, and protocol views. |
| Kubernetes security | Pod and workload inventory, Kubernetes network policy visibility, and container runtime attribution. |
| Compliance evidence | CIS Controls v8, NIS2, 3GPP TS 33.117, and O-RAN WG11 reports with per-control evidence. |
| AI-assisted analysis | An AI assistant with 44 tools that can query fleet data, correlate events, and help write detection rules. |
| SIEM forwarding | Event export to Microsoft Sentinel, Splunk, Elastic, OpenSearch, or any HTTP endpoint. |
| Long-term event storage | Optional Parquet export to S3 or MinIO for external analytics pipelines. |
What Telovix is not
- It is not a SaaS control plane that requires outbound connectivity for runtime operation in Telovix self-hosted deployments.
- It is not intrusive by default. Every node starts in observe-only mode and enforcement requires explicit operator approval.
- It does not require kernel patches or custom kernel builds as part of the deployment model.
- It does not store raw events in PostgreSQL. Runtime events go to ClickHouse. PostgreSQL holds only operational state.
Next steps
- Quick Start for the first Console and Sensor
- Architecture Overview for storage layers, trust model, and data flow
- Requirements for host, kernel, and network prerequisites
- Sensor Flavors for the full capability comparison between standard and telecom