Appearance
Quick Start
| Path | Who operates the Console | Start here |
|---|---|---|
| Telovix self-hosted | You | Telovix self-hosted Quick Start |
| Telovix Cloud | Telovix | Telovix Cloud Quick Start |
Both paths begin with a subscription from the Telovix Portal. After payment is confirmed, you choose whether to deploy the Console yourself or have Telovix operate it for you. The sensor is always deployed by you on your own nodes, regardless of which path you take.
Telovix self-hosted Quick Start
Outcome: a running Console with databases configured, one enrolled Sensor sending heartbeats, and a real detection event visible in the Console - triggered by you, within the first session.
Estimated time: 20 to 30 minutes depending on database provisioning.
Prerequisites
| Requirement | Minimum | Notes |
|---|---|---|
| Portal account | Active subscription | Sign up at portal.telovix.com |
| Console host | Linux, 2 CPU, 2 GB RAM | Dedicated VM or bare metal recommended |
| PostgreSQL | 15 or later | Must be reachable from the Console host |
| ClickHouse | 24.8 or later | Must be reachable from the Console host |
| Sensor host | Linux, kernel 5.8+, BTF enabled | Any node you want to protect |
| CPU architecture | x86_64 or aarch64 | Both Console and Sensor binaries available for each |
| Network | Sensor can reach Console on port 15483 (Telovix self-hosted default) | Outbound only from the Sensor |
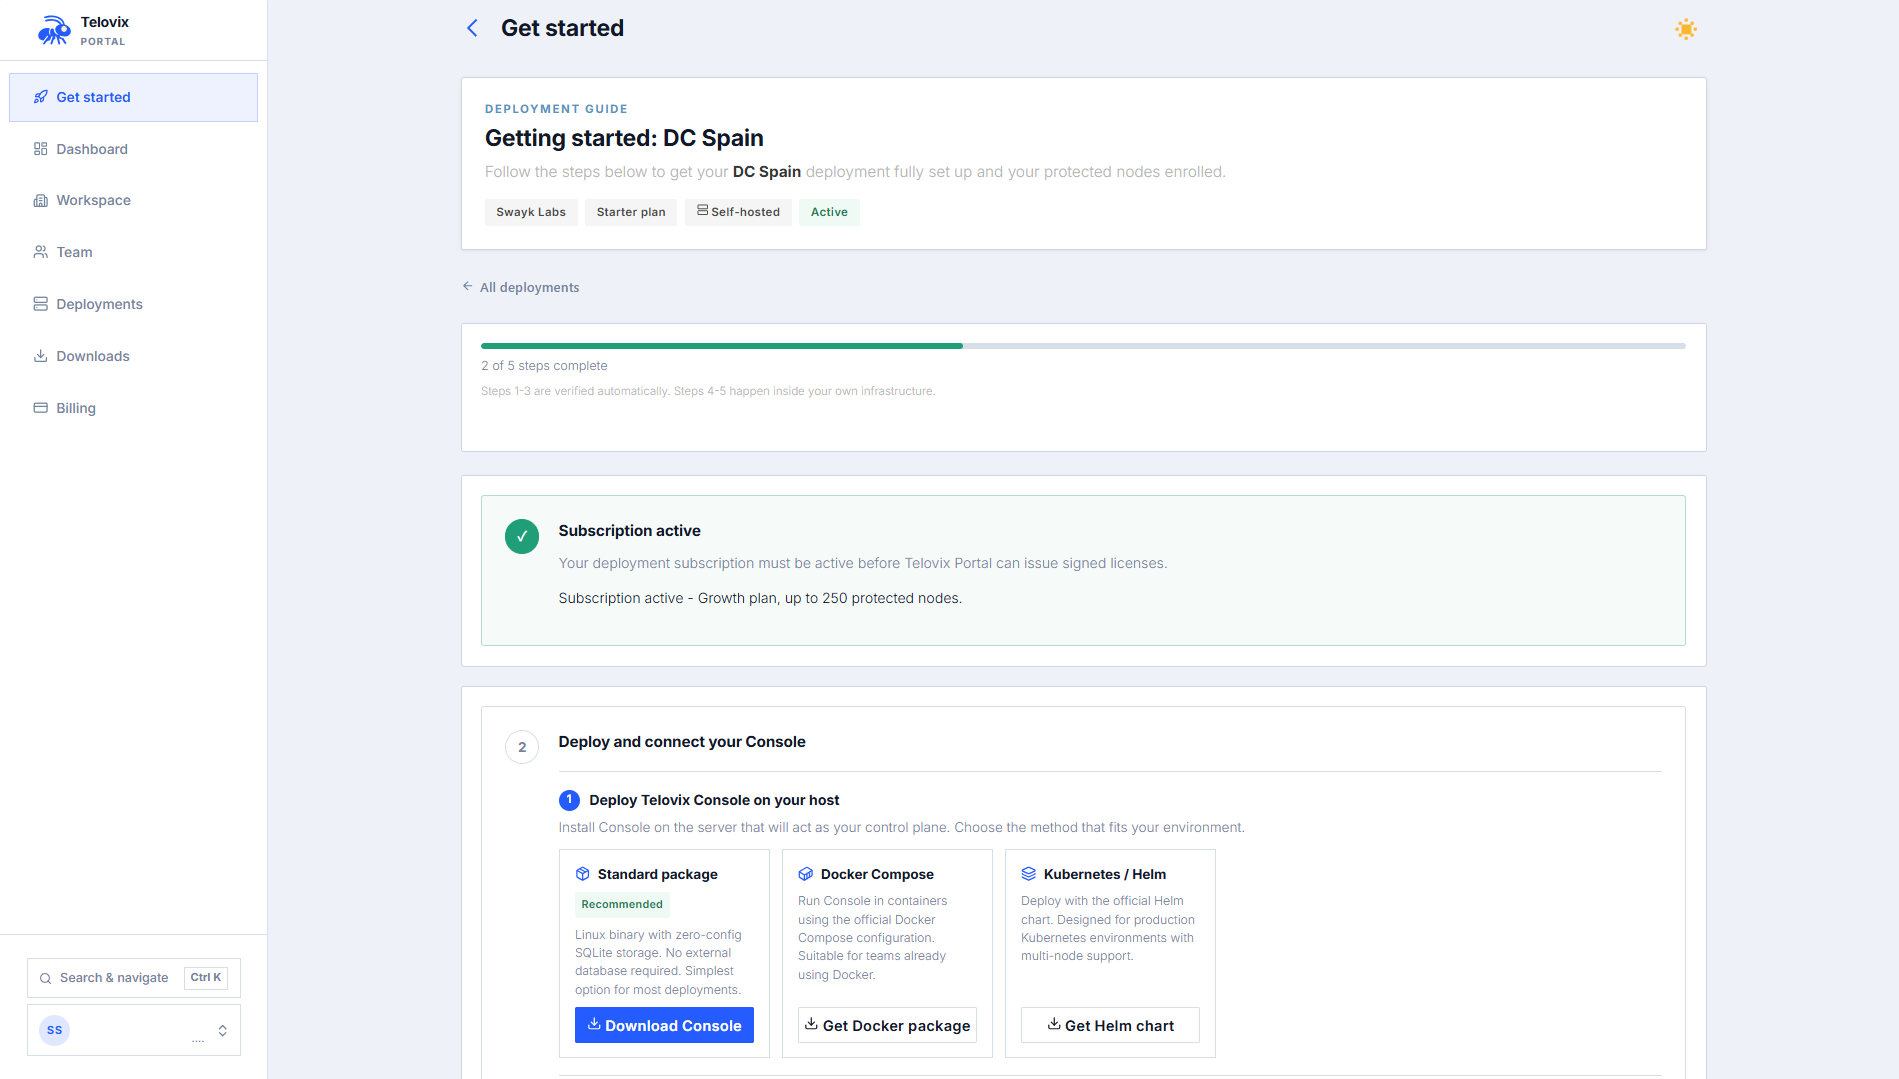
Step 1: Get the Console binary and license bundle from the Portal
Log in to portal.telovix.com. If you do not have a workspace yet, sign up first. The signup collects your name, email, company name, plan, and billing period, then redirects to Stripe Checkout. Your workspace is activated after Stripe confirms payment via a webhook, not from the redirect alone.
Once your workspace is active:
- Go to Getting Started and create a Telovix self-hosted deployment.
- On the deployment page, click Issue License to generate a signed license bundle. Download the
.jsonfile. - Go to Downloads and download the Console binary for your architecture (
amd64orarm64).
Step 2: Start PostgreSQL and ClickHouse
The Console will not complete startup without both databases reachable.
PostgreSQL: quick start with Docker
bash
docker run -d --name telovix-pg \
  -e POSTGRES_DB=telovix_console \
  -e POSTGRES_USER=telovix_console \
  -e POSTGRES_PASSWORD=change-me \
  -p 5432:5432 \
  -v pg-data:/var/lib/postgresql \
  postgres:18-bookworm
Or create a database on an existing instance:
bash
createuser --pwprompt telovix_console
createdb -O telovix_console telovix_console
ClickHouse: quick start with Docker
bash
docker run -d --name telovix-ch \
  -e CLICKHOUSE_DB=telovix_console \
  -e CLICKHOUSE_USER=telovix_console \
  -e CLICKHOUSE_PASSWORD=change-me \
  -p 8123:8123 \
  -v ch-data:/var/lib/clickhouse \
  clickhouse/clickhouse-server:24.8-alpine
Verify both are reachable before continuing:
bash
pg_isready -h 127.0.0.1 -p 5432
curl -sf http://127.0.0.1:8123/ping && echo "ClickHouse OK"
Step 3: Install and start the Console
Install the binary
bash
sudo install -m 0755 telovix-console-amd64 /usr/local/bin/telovix-consoleCreate a service account and directories
bash
sudo useradd --system --no-create-home --shell /usr/sbin/nologin telovix-console 2>/dev/null || true
sudo install -d -o telovix-console -g telovix-console -m 0750 \
  /etc/telovix-console \
  /var/lib/telovix-console
Create the service directories
bash
sudo install -d -o telovix-console -g telovix-console -m 0750 \
  /etc/telovix-console \
  /var/lib/telovix-console
The Console reads its configuration from a file written by the setup wizard on first run. No manual configuration file is needed before starting the Console for the first time.
Register the systemd unit
Create /etc/systemd/system/telovix-console.service:
ini
[Unit]
Description=Telovix Console
After=network-online.target

[Service]
Type=simple
User=telovix-console
Group=telovix-console
EnvironmentFile=/etc/telovix-console/env
WorkingDirectory=/var/lib/telovix-console
ExecStart=/usr/local/bin/telovix-console
Restart=on-failure
RestartSec=10
KillMode=process
TimeoutStopSec=15

[Install]
WantedBy=multi-user.target
bash
sudo systemctl daemon-reload
sudo systemctl enable --now telovix-console
sudo journalctl -u telovix-console -f
The Console starts in first-run mode and serves only the setup wizard until it is completed.
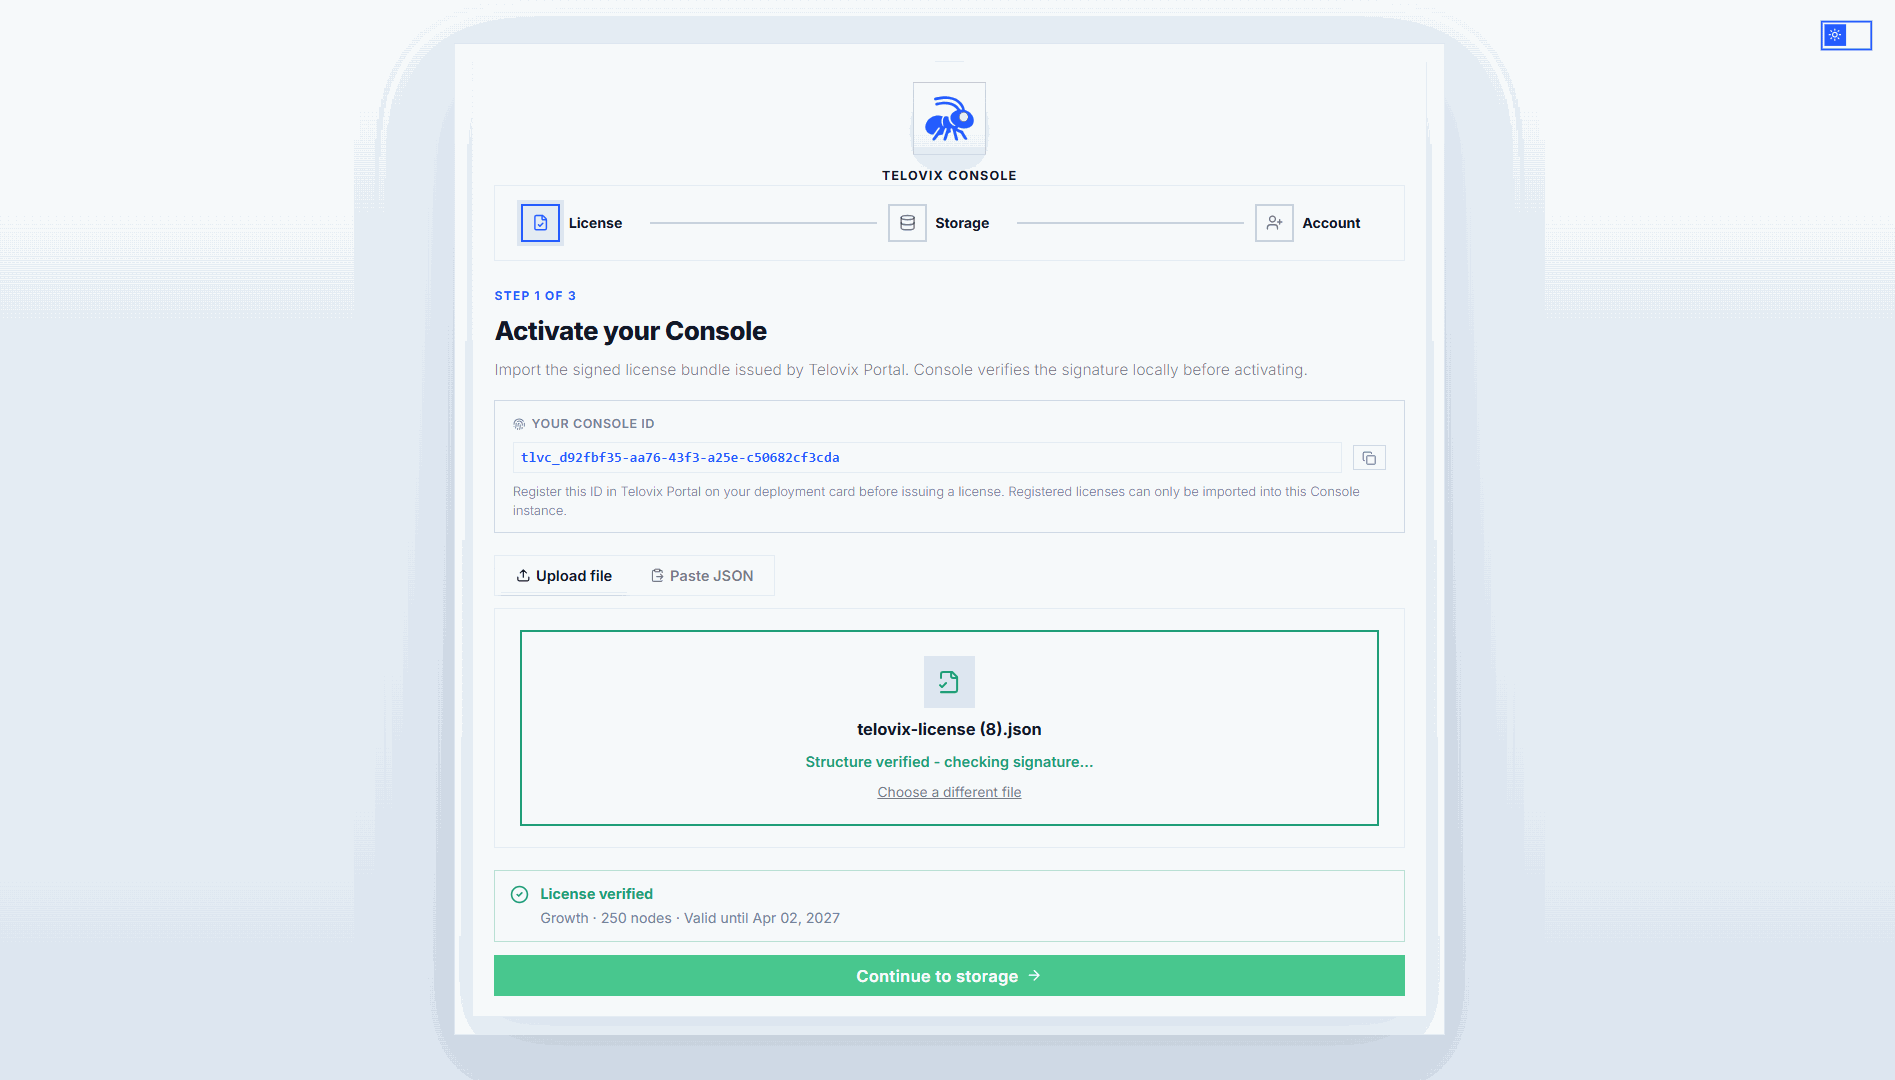
Step 4: Complete the setup wizard
Open https://console.example.com:15483 (Telovix self-hosted default) in a browser. The wizard launches automatically on first startup before any configuration exists and guides you through license import, storage configuration, and first-account creation.
4a: Import the license
Upload the signed license bundle (.json) you downloaded from the Portal. The Console validates the Ed25519 signature offline. No network connection to Telovix services is needed after import.
4b: Configure storage
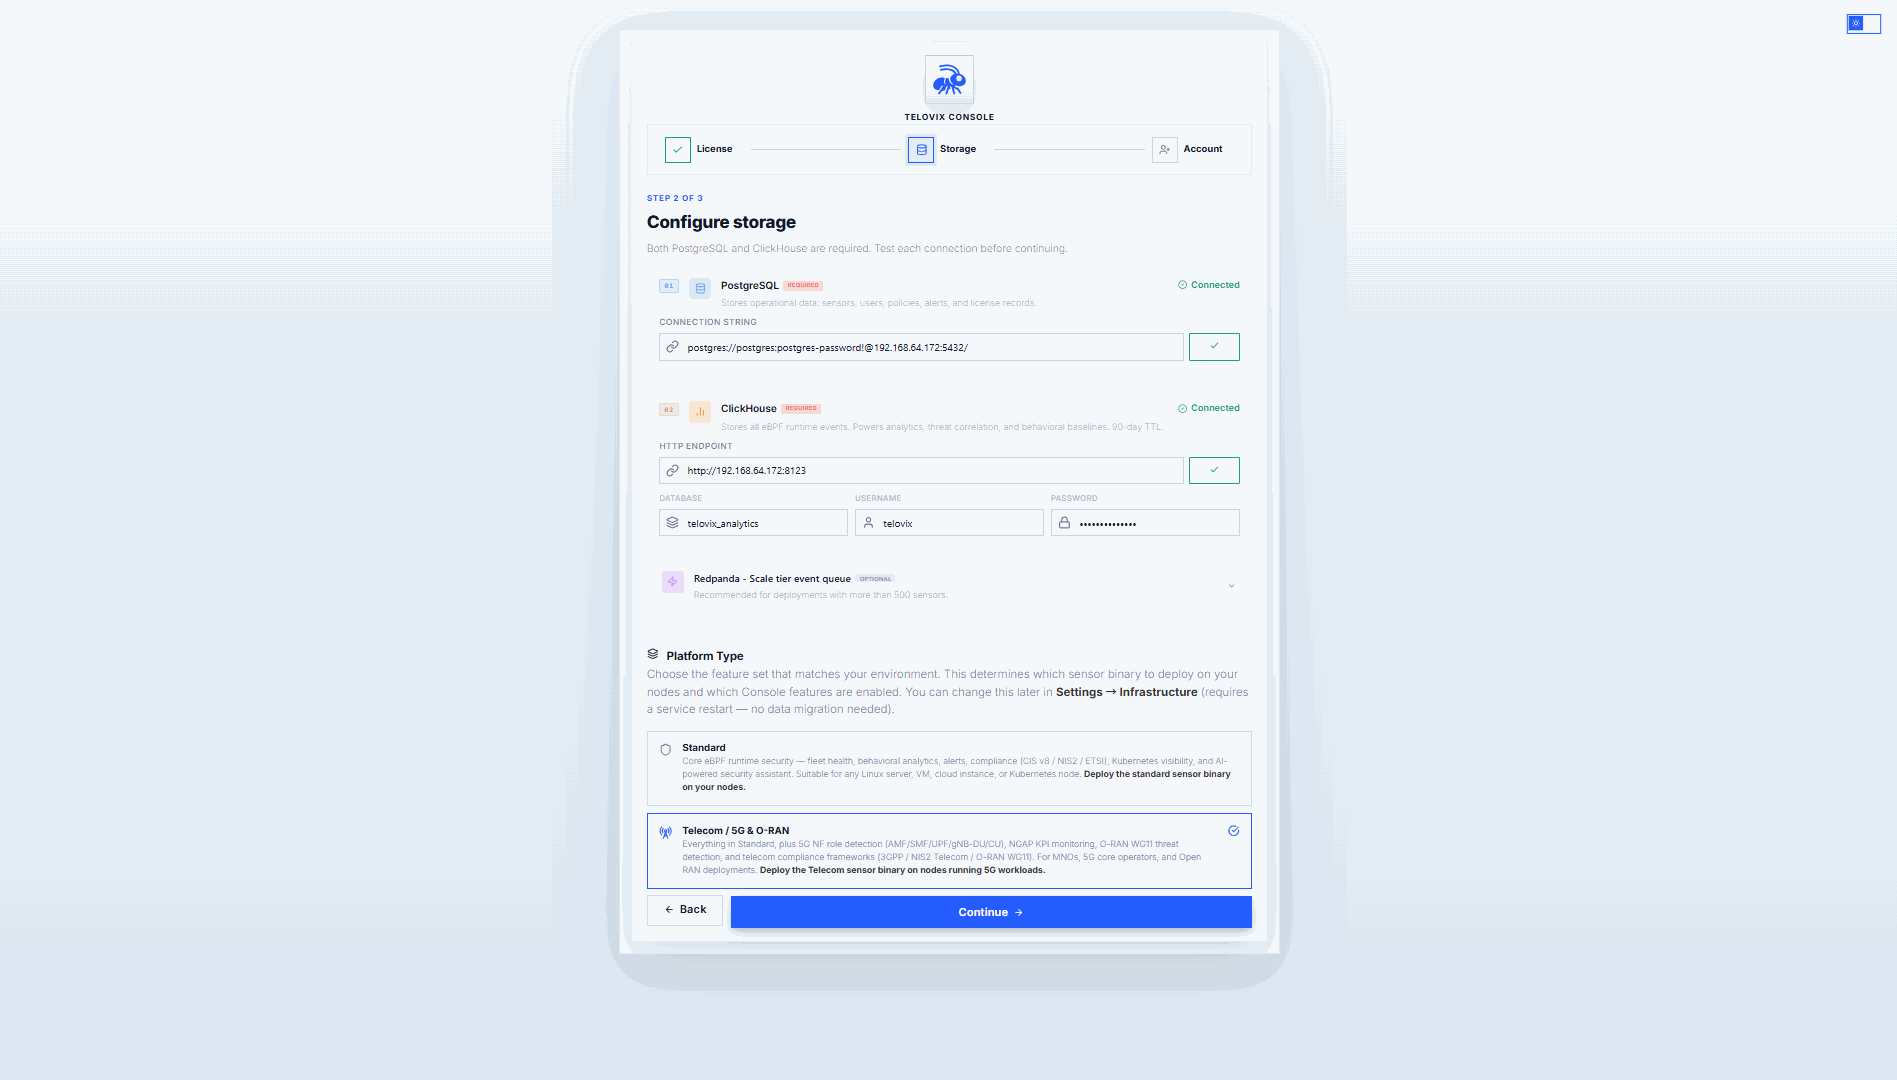
| Field | Example value | Required |
|---|---|---|
| PostgreSQL URL | postgres://telovix_console:change-me@127.0.0.1:5432/telovix_console | Yes |
| ClickHouse URL | http://127.0.0.1:8123 | Yes |
| Platform vertical | standard or telecom | Yes |
| Redpanda broker | redpanda-host:9092 | No. Scale tier only, recommended above 1,500 nodes. |
The wizard tests each connection before you can continue. When you complete the final account step, the Console applies PostgreSQL migrations and the ClickHouse schema. Storage cannot be changed after the first admin account is created.
Choose the platform vertical:
- Standard: core eBPF security. The correct choice for most deployments.
- Telecom: adds 5G Core and O-RAN NF monitoring, NGAP KPIs, and the Telco section in the UI. Use this if your nodes run network functions such as AMF, SMF, UPF, O-DU, or O-CU, and if you are deploying the telecom sensor flavor.
4c: Create the first admin account
Enter an email address, a display name, and a password. Password requirements: minimum 12 characters, at least one uppercase letter, one lowercase letter, one number, and one symbol. No spaces or tabs allowed.
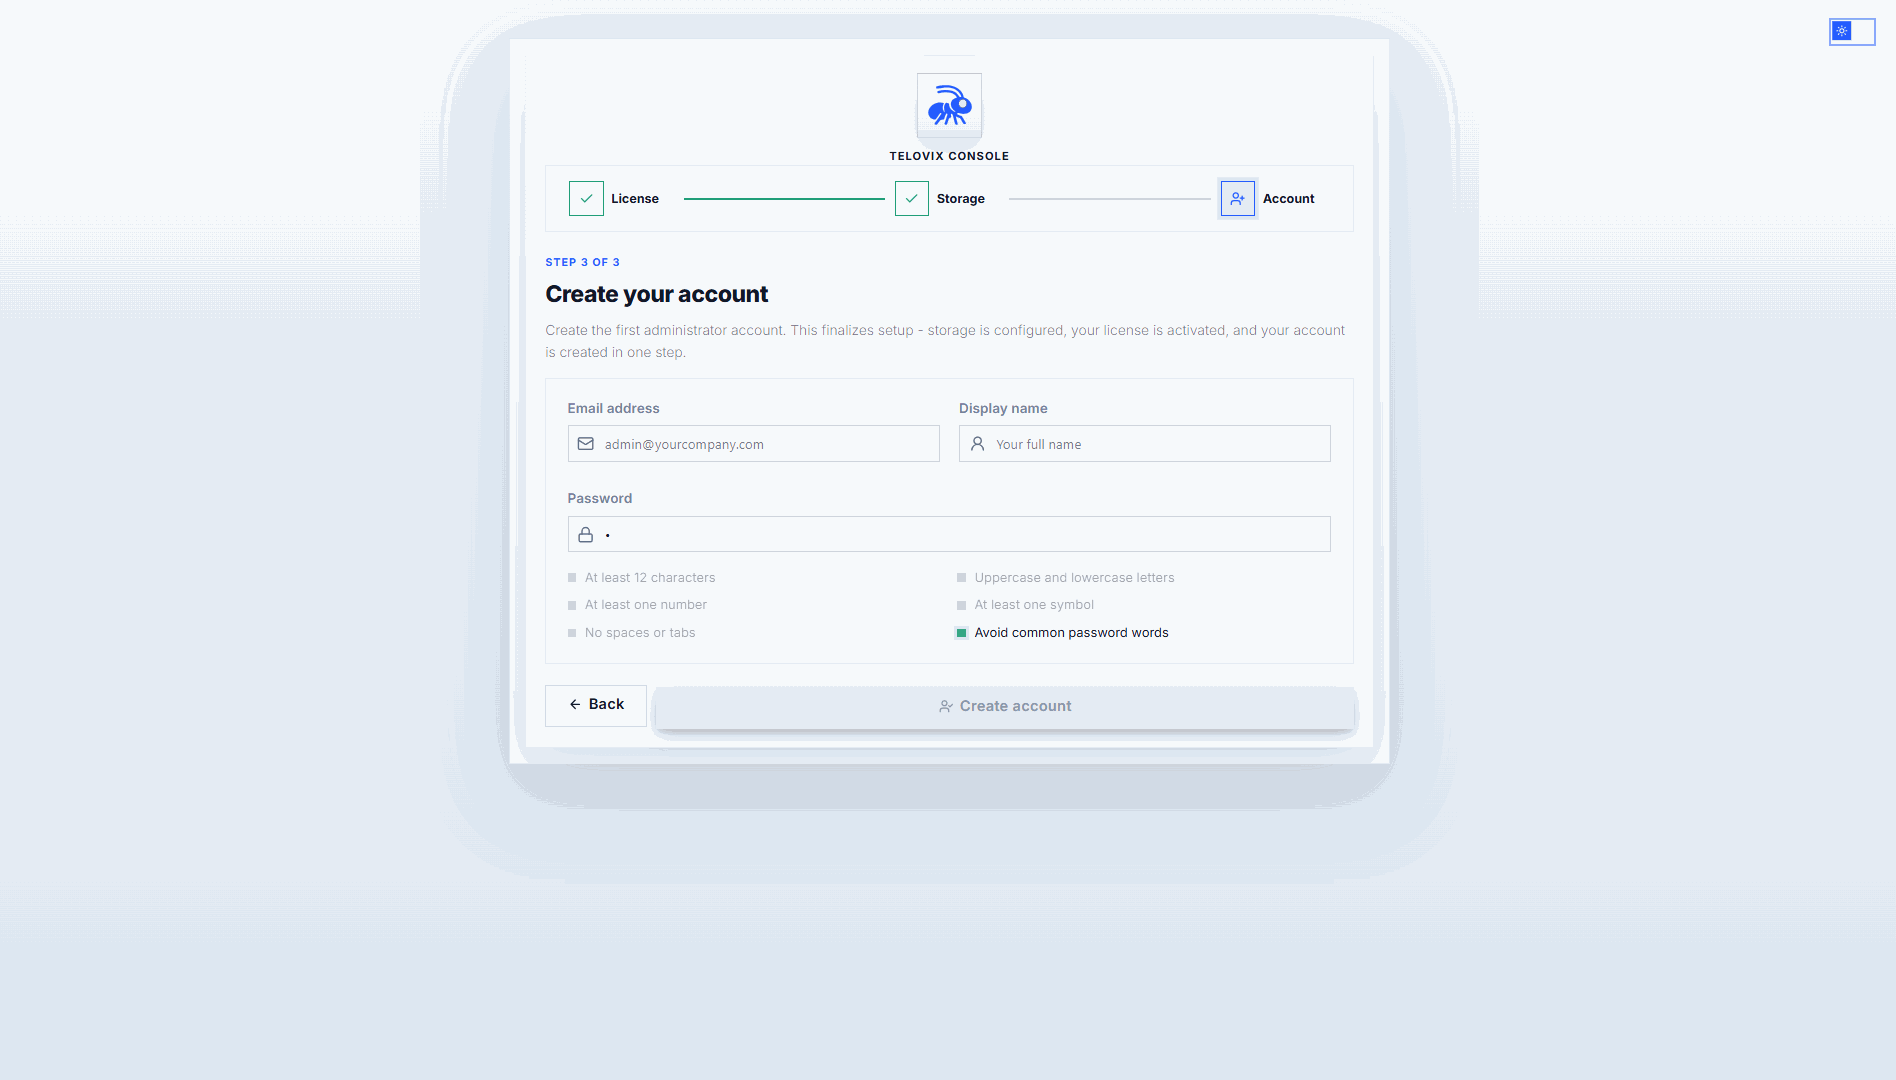
After the admin account is created, the wizard saves the configuration, activates the database connections and event sink in memory, and starts all background tasks. The Console redirects you to the login page.
Step 5: Enroll your first Sensor
Log in with the admin credentials you just created.
Generate an enrollment token
Go to Sensors and click Deploy Sensor. Select VM / Bare Metal, enter a node name, and select a node role. The wizard generates a ready-to-run install command with an enrollment token embedded. The token is valid for 15 minutes.
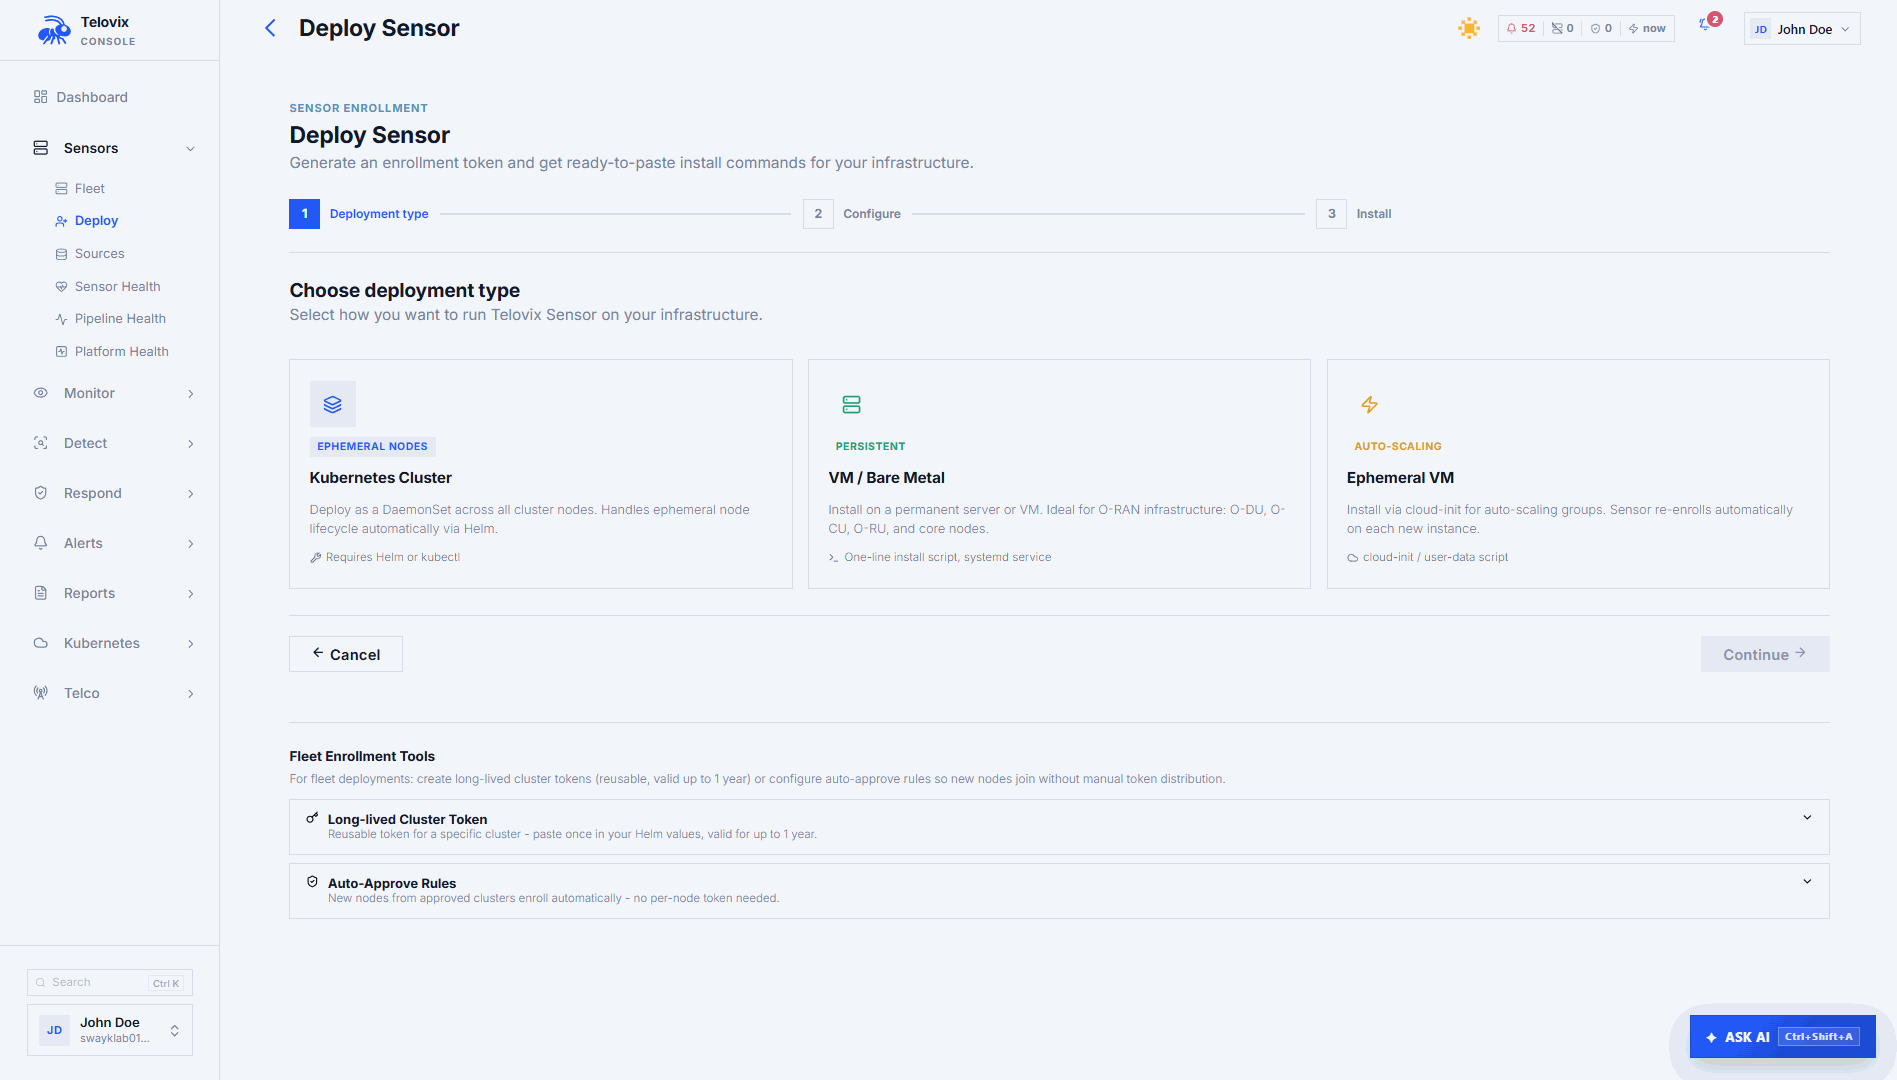
Available node roles:
| Role | Use for |
|---|---|
generic_linux | Any standard Linux host (default) |
amf | 5G Core Access and Mobility Management Function |
smf | 5G Core Session Management Function |
upf | 5G Core User Plane Function |
o_du | O-RAN Distributed Unit |
o_ru | O-RAN Radio Unit |
o_cu_cp | O-RAN Central Unit Control Plane |
o_cu_up | O-RAN Central Unit User Plane |
near_rt_ric | O-RAN near-RT RAN Intelligent Controller |
Run the install command on the target node as root
Copy the command shown in the wizard and run it as root on the target node. The command embeds the enrollment token, Console URL, node name, node role, and tags. It expires after 15 minutes.
The install script does the following:
- Downloads the Sensor binary for the detected architecture (
x86_64oraarch64). - Downloads the Console bootstrap CA certificate if the Console uses a self-signed or private CA.
- Writes the sensor configuration to
/etc/telovix-sensor/(mode600). - Installs and starts the
telovix-sensorsystemd service.
::: note The Sensor runs as root. eBPF kernel tracing, BPF filesystem access, and memory locking all require full root capabilities. The install script exits immediately if systemctl is not found. For Kubernetes deployments use the Helm chart instead. :::
Check the sensor host
bash
systemctl status telovix-sensor
journalctl -u telovix-sensor -n 30 --no-pager
Look for lines containing enrolled successfully and heartbeat sent.
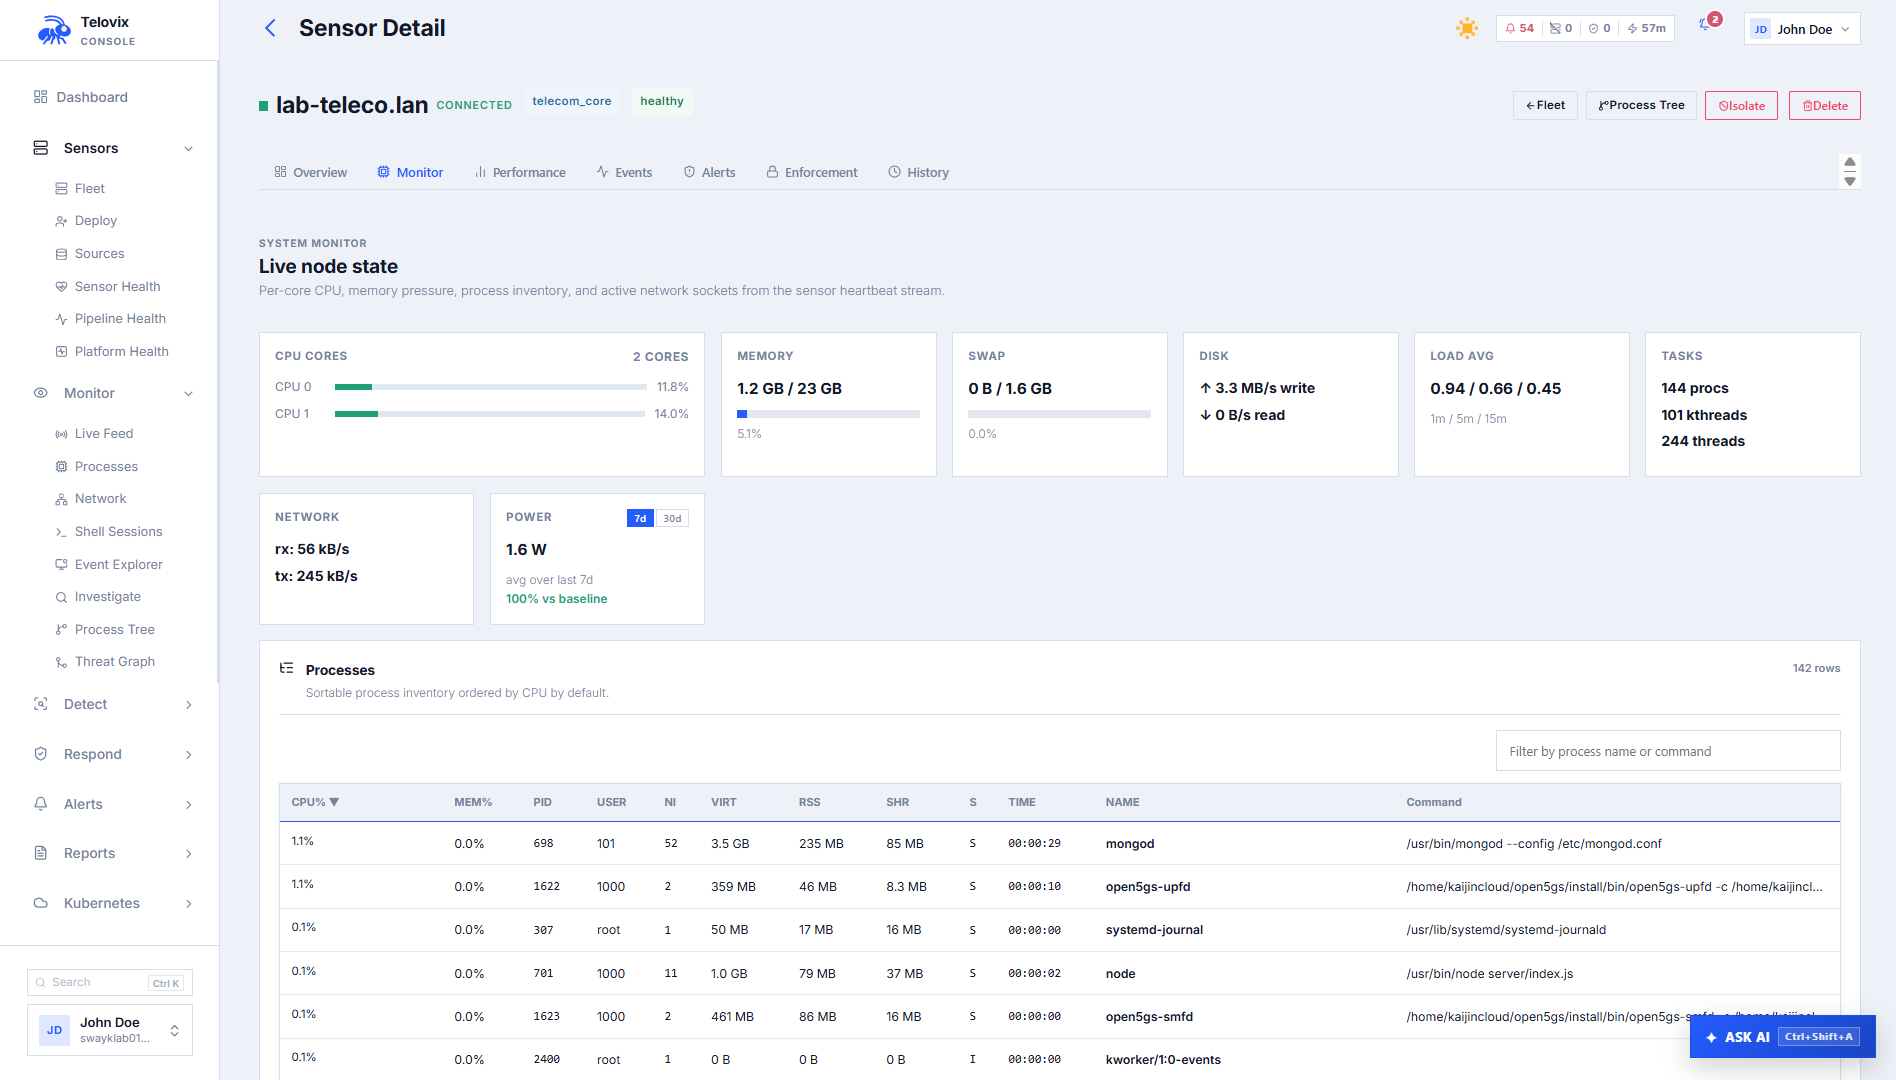
Confirm in the Console
The sensor appears in Sensors within one heartbeat cycle (up to 15 seconds). Trust state should show healthy.
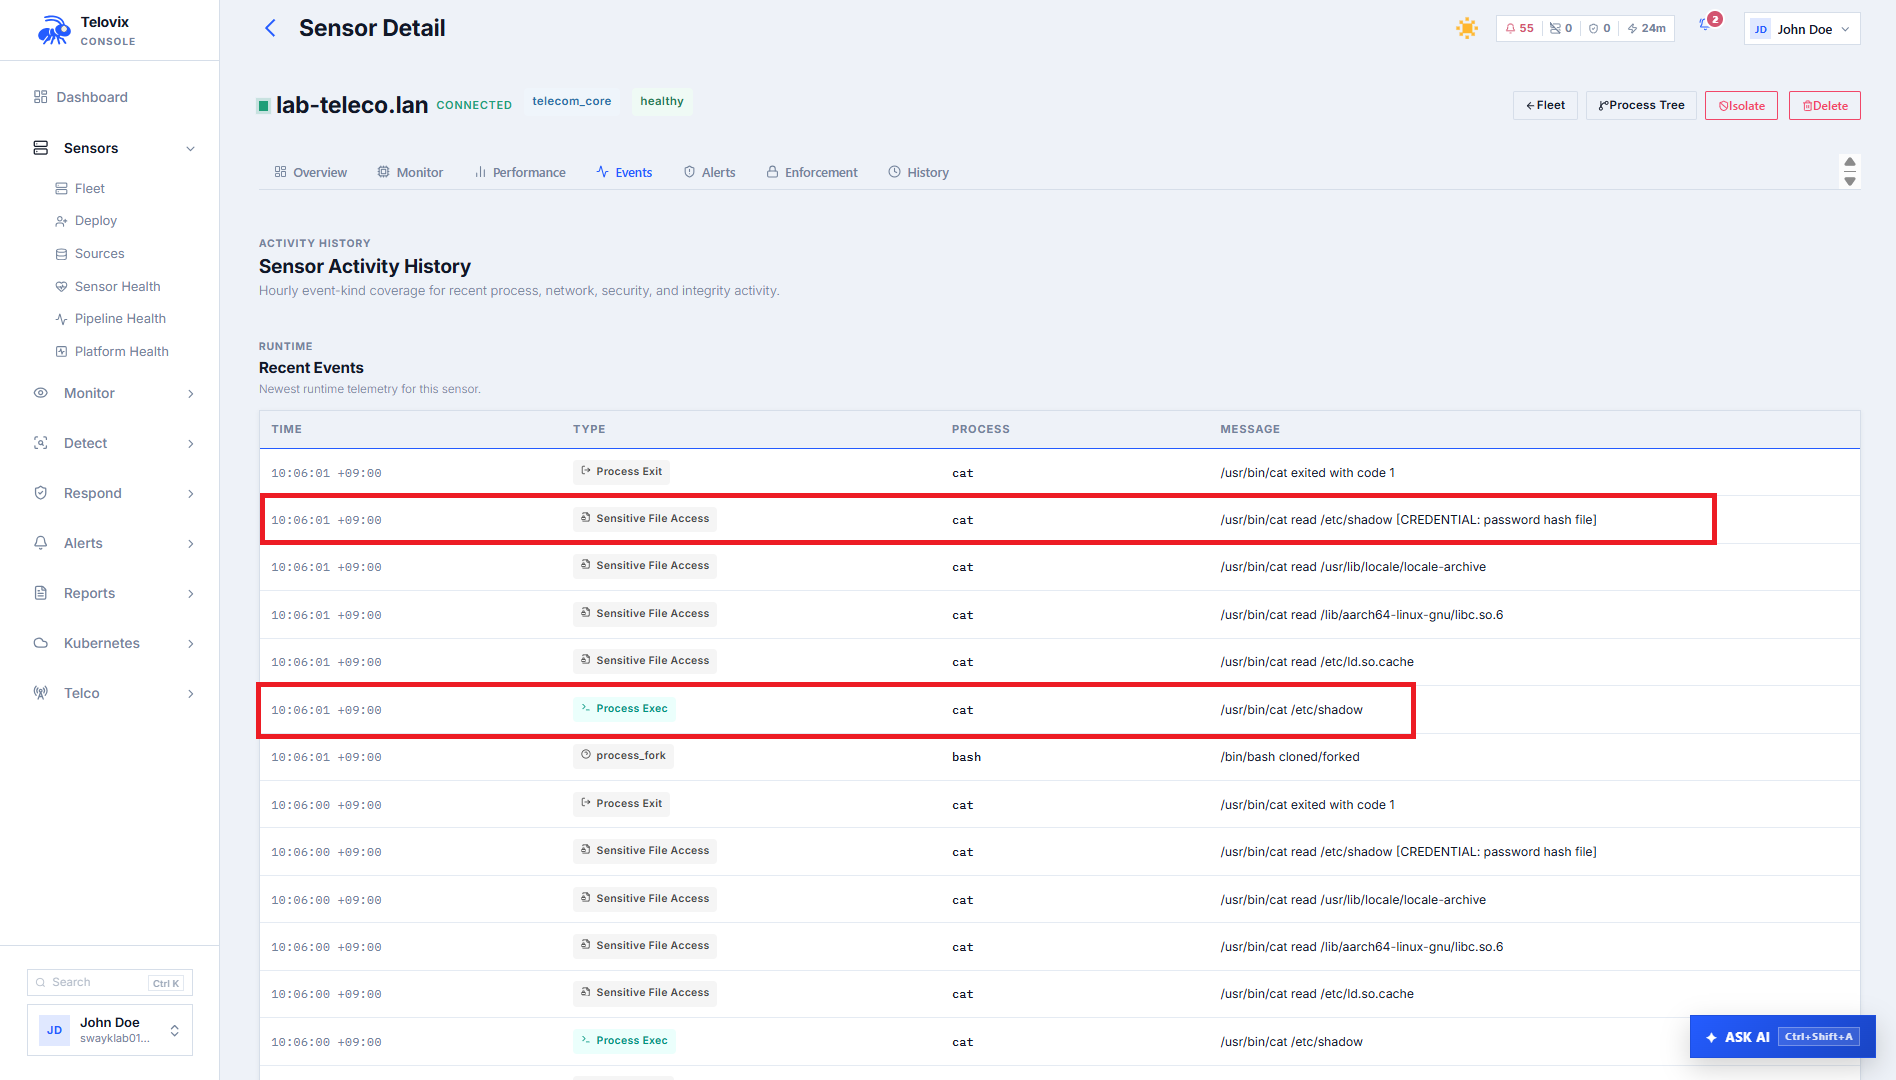
Step 6: Trigger your first detection
This step proves that telemetry is flowing end-to-end from the sensor to the Console. Run a command on the enrolled node that the sensor is monitoring, then watch the event appear in real time.
On the sensor host, run:
bash
cat /etc/shadowThis accesses /etc/shadow, a sensitive credential file. The sensor captures the file_open event at the kernel level and delivers it to the Console within one heartbeat cycle (up to 15 seconds).
In the Console:
- Click the sensor name in Sensors to open its detail page.
- Go to Recent Events. Within 15 seconds of running the command you should see a
file_openevent with:- Process:
cat - File:
/etc/shadow - Severity:
info
- Process:
If you do not see the event after 30 seconds, try a second trigger command:
bash
# This generates a privilege_change event
sudo -i whoami
If the event list is still empty after another 30 seconds, check the sensor host:
bash
journalctl -u telovix-sensor -n 50 --no-pager | grep -E "heartbeat|error|failed|enroll"Look for lines containing heartbeat sent. If you see heartbeat errors, check:
- The sensor can reach the Console:
curl -k https://console.example.com:15483/healthz(Telovix self-hosted only) - System clocks on both hosts agree within a few seconds (mTLS rejects large clock skew)
- No firewall or transparent proxy is blocking port
15483(Telovix self-hosted default) - The Console itself is healthy:
curl -sf http://127.0.0.1:8123/pingfrom the Console host confirms ClickHouse is reachable
Telovix Cloud Quick Start
Outcome: a Telovix Cloud Console URL you can log in to immediately, with a real detection event visible after enrolling your first sensor.
Telovix provisions and operates the Console, PostgreSQL, and ClickHouse. You never see or manage the database layer.
Step 1: Create a Portal account
Go to portal.telovix.com and sign up. The signup flow asks for your name, email, company name, a plan, and a billing period. You are then redirected to Stripe Checkout.
Available plans:
| Plan | Max protected nodes | Support tier |
|---|---|---|
| Trial | 5 | Standard |
| Starter | 100 | Standard |
| Growth | 250 | Priority |
| Scale | 500 | Professional |
Your workspace is activated after Stripe confirms payment via a verified webhook. The page polls for activation and redirects you to the Portal automatically once it is complete. Workspace activation never happens from the payment redirect alone.
::: note Trial plan Trial workspaces include one pre-provisioned Telovix Cloud Console. You can proceed to Step 2 immediately after account creation. Trials do not require payment. :::
Step 2: Create a Telovix Cloud deployment and request provisioning
In the Portal, go to Getting Started or Deployments and create a new deployment. Choose Telovix Cloud as the deployment mode.
Once the deployment is created, click Provision Console. The Portal prompts you for:
- Admin email: the email for the first Console operator account
- Admin display name: the name shown in the Console UI
- Admin password: minimum 12 characters, at least one uppercase letter, one lowercase letter, one number, one symbol, no spaces
📸 Screenshot: portal-provision-form Portal provisioning form showing the admin email, display name, and password fields with the password strength checklist.
After you submit, the deployment moves to Queued status. Telovix creates the infrastructure and injects your license automatically. You do not need to import a license file.
The Portal shows provisioning progress in real time:
| Status | Meaning |
|---|---|
| Queued | Your request has been received |
| Provisioning | Infrastructure is being created |
| Ready | Your Console URL is available |
Step 3: Log in to your Console
Once the status shows Ready, the Console URL appears in the Portal. Open it in your browser and log in with the admin credentials you provided in Step 2. No setup wizard runs in Telovix Cloud mode. The Console is immediately operational.
📸 Screenshot: portal-console-ready Portal deployment card showing Ready status with the Console URL and a direct login button.
Step 4: Enroll your first Sensor and trigger a detection
Enroll the sensor using the same process as the Telovix self-hosted path. Log in to your Console, go to Sensors, click Deploy Sensor, and follow Step 5 of the Telovix self-hosted guide above.
The Console URL provided by Telovix may use port 443 (Telovix Cloud) rather than 15483 (Telovix self-hosted default). Use whatever URL appears in the Portal and in the generated install command. Do not manually append :15483.
Trigger your first detection by running this on the enrolled sensor host:
bash
cat /etc/shadowWithin 15 seconds, a file_open event for /etc/shadow appears under Recent Events in Sensors > [sensor]. This confirms the full telemetry path is working: sensor capture, mTLS delivery, and ClickHouse storage. See Step 6 of the Telovix self-hosted guide for troubleshooting if the event does not appear.
What happens next
Every node starts in observe-only mode. No enforcement runs until you explicitly enable it.
Recommended next steps in order:
- Review the Pilot Checklist before enrolling more nodes.
- Read Sensor Health and Heartbeat to understand the trust states and the staleness window.
- Assign a policy pack from Sensors > [sensor] > Assign Pack to begin structured detection coverage.
- Let the behavioral baselines build for at least 14 days before reviewing anomaly scores.
- After validating baseline behavior, move selected nodes to enforcement through Runtime Blocks.
Troubleshooting
Browser shows setup wizard on every restart (Telovix self-hosted only)
The Console configuration was not saved to a persistent location. Check that WorkingDirectory in the systemd unit points to a writable directory owned by the telovix-console service account.
Sensor shows stale in fleet
Heartbeats stopped reaching the Console. Run journalctl -u telovix-sensor -f on the sensor host to see whether the sensor is running and whether heartbeat attempts are producing errors.
Sensor shows enrollment_failed
The enrollment token expired before the install completed, or the Console URL used during install was incorrect. Regenerate a fresh token from Sensors > Deploy Sensor and verify the Console URL is correct before running the install command again.
Sensor shows revoked
The Console revoked this sensor identity. A plain enrollment token is not sufficient to reconnect a revoked sensor. Generate a re-enrollment token from Sensors > [sensor] > Actions > Generate Re-enrollment Token, which is specifically issued for this case.
No events in Console
ClickHouse is unreachable from the Console host. Run curl -sf http://<ch-host>:8123/ping from the Console host to confirm connectivity. Restore ClickHouse reachability and events will resume flowing.
Install script exits: systemctl not found
The target host does not have systemd. The install script requires systemd to register the sensor service. Use the Kubernetes Helm chart for hosts without systemd.
Install script exits: architecture not supported
The detected CPU architecture is not x86_64 or aarch64. Only amd64 and arm64 sensor binaries are provided. The install script will not continue on unsupported architectures.
Portal deployment stays at Queued
Provisioning has not yet started or is delayed. Wait a few minutes and refresh the page. If the status does not advance to Provisioning, contact support with your deployment ID.
License import fails in wizard
The license bundle was issued for a different workspace. Re-issue the license from the Portal for this specific deployment, then import the newly downloaded .json file.