User Plane (GTP-U / PFCP)
The user plane in 5G and 4G networks carries subscriber data through GTP-U tunnels controlled by PFCP sessions. Telovix monitors both planes on UPF, SMF, SGW, and gNB nodes, using AF_PACKET capture on the network interface plus eBPF instrumentation of the process layer.
Requires: Telecom sensor flavor.
How the sensor monitors the user plane
The sensor uses two capture paths simultaneously:
AF_PACKET capture reads raw packets from the configured monitoring interface. This interface is auto-detected through four steps in order: telecom socket analysis (looking for GTP-U and PFCP bindings), default route interface, first physical interface, then eth0. The monitoring interface can be set explicitly in Console Settings when the auto-detection picks the wrong interface. AF_PACKET capture provides GTP-U header parsing and PFCP message decoding.
eBPF instrumentation tracks process behavior on the same node: which binary owns port 2152 or 8805, what system calls the UPF process makes, and whether any privilege or integrity anomalies occur on the host running user-plane functions.
Both paths contribute data to the same heartbeat payload, so GTP-U anomalies and process-level events appear in the same timeline.
PFCP (Packet Forwarding Control Protocol)
PFCP runs between the SMF and UPF over UDP port 8805. In 5G this is the N4 interface. In 4G EPC, the equivalent interfaces are Sxa (SGW-C to SGW-U) and Sxb (PGW-C to PGW-U).
What the sensor decodes
The sensor decodes the PFCP message header (version, message type, sequence) and extracts Session Establishment Data:
| Rule type | Contents captured |
|---|---|
| PDR (Packet Detection Rule) | Source interface, destination, precedence order |
| FAR (Forwarding Action Rule) | Action: forward, duplicate, or drop |
| URR (Usage Reporting Rule) | Volume threshold that triggers a usage report |
Session tracking
Each PFCP session is tracked by its SEID (Session Endpoint Identifier), which maps to a UE session. The sensor records the full session state transition sequence:
| State | Meaning |
|---|---|
| Created | Session establishment accepted |
| Modified | Session parameters updated |
| Active | Data plane is live |
| Deleted | Session terminated |
Per-session QoS parameters are recorded at session creation: the 5QI (5G QoS Indicator) determines the traffic class and scheduling priority; the AMBR (Aggregate Maximum Bitrate) defines the maximum throughput allowed for this UE session.
PFCP metrics
| Metric | SLO | Anomaly trigger |
|---|---|---|
| Session create latency (SMF to UPF) | < 100ms | Exceeded |
| Session modification rate per UPF | Tracked (baseline) | Spike above baseline |
| Dropped packet count | 0 | Any non-zero value |
The session create latency SLO (< 100ms). Exceeding it consistently indicates UPF overload or N4 path degradation.
PFCP anomalies
| Anomaly | Meaning |
|---|---|
| Invalid SEID | Packet references a session not in the current table; routing error or potential spoofing |
| SEID collision | Two sessions share the same SEID; session hijacking risk |
| Session churn | Rapid cycle of create and delete; may indicate attach storm or targeted disruption |
PFCP data from the heartbeat is available in the pfcp_session_report, pfcp_msg_report, pfcp_seid_report, and pfcp_metrics_report fields.
GTP-U (GPRS Tunneling Protocol User Plane)
GTP-U carries subscriber IP packets inside tunnels over UDP port 2152. In 5G the relevant interfaces are N3 (gNB to UPF) and N9 (UPF to UPF). In 4G the equivalent is S1-U (eNB to SGW).
What the sensor decodes
From each GTP-U packet the sensor extracts:
- Version and PT flag (protocol type)
- E/S/PN flags (extension header, sequence, N-PDU number presence)
- Message type
- TEID (Tunnel Endpoint Identifier)
- Sequence number
- Inner PDU type (IPv4 or IPv6)
The TEID is mapped to a UE session. The sensor builds and maintains a TEID-to-session table per UPF. When a TEID appears that is not in the table, the sensor flags it as an anomaly.
Endpoint role classification
The sensor assigns an interface role based on the process binding port 2152 and its declared NF role:
| NF role | GTP-U interface |
|---|---|
| UPF | N3 (from gNB) and N9 (from peer UPF) |
| gNB | N3 (UE tunnel ingress toward UPF) |
| SGW or eNB | S1-U (4G) |
GTP-U anomalies
| Anomaly | Meaning |
|---|---|
| TEID Reuse | Same TEID reused by different PDN connections; session hijacking risk |
| Out-of-Order Packets | Sequence number discontinuities; congestion or packet reordering attack |
| Invalid TEID | Packet with TEID not in current session table; routing error or spoofing |
| Encapsulation Loop | GTP-U packet containing another GTP-U packet; stack overflow attack |
| Payload Size Anomaly | Inner packet larger than tunnel MTU; fragmentation bypass attempt |
GTP-U anomaly data from the heartbeat appears in the gtpu_anomaly_report field. The tunnel inventory is in gtpu_inventory and per-TEID tracking is in gtpu_teid_report.
Visibility gap detection
High-throughput UPF deployments often bypass the kernel packet path using AF_XDP, VFIO, or DPDK. When this happens, the sensor cannot observe GTP-U packets via AF_PACKET. The sensor detects these techniques and flags the gap explicitly:
| Technique | Detection method |
|---|---|
| AF_XDP (eXpress Data Path) | /proc/{pid}/maps checked for xdp_* entries |
| VFIO (Virtual Function I/O) | IOMMU group soft links in /sys/bus/pci |
| DPDK (Data Plane Development Kit) | Hugepage allocations in /proc/meminfo |
When AF_XDP or VFIO is detected on GTP-U port 2152, the sensor sets gtp_visibility_gap=true in the heartbeat (visibility_gap_report field). The Console displays a warning on the UPF node: "User plane traffic not visible to eBPF monitoring."
A visibility gap does not stop other monitoring. PFCP control-plane sessions, process behavior, privilege events, file integrity, and network connections remain fully visible. Only the GTP-U encapsulated data plane packets are inaccessible.
UDP listeners
UDP listeners for GTP-U (port 2152) and PFCP (port 8805) are reported from the heartbeat snapshot. These are served separately from TCP listeners because they come from /proc/net/udp rather than /proc/net/tcp.
In the Console, go to Sensors > [sensor] > Network > UDP Listeners. Each record shows the local IP and port, remote address (0.0.0.0 for unconnected), state, UID, inode, drop count, PID, binary path, and interface name (e.g., GTP-U).
The drop count field is particularly useful for user-plane monitoring: a non-zero drop count on port 2152 indicates that UDP receive buffer is saturating, which can be an early indicator of a GTP-U flood attack or UPF overload.
Console views for user plane
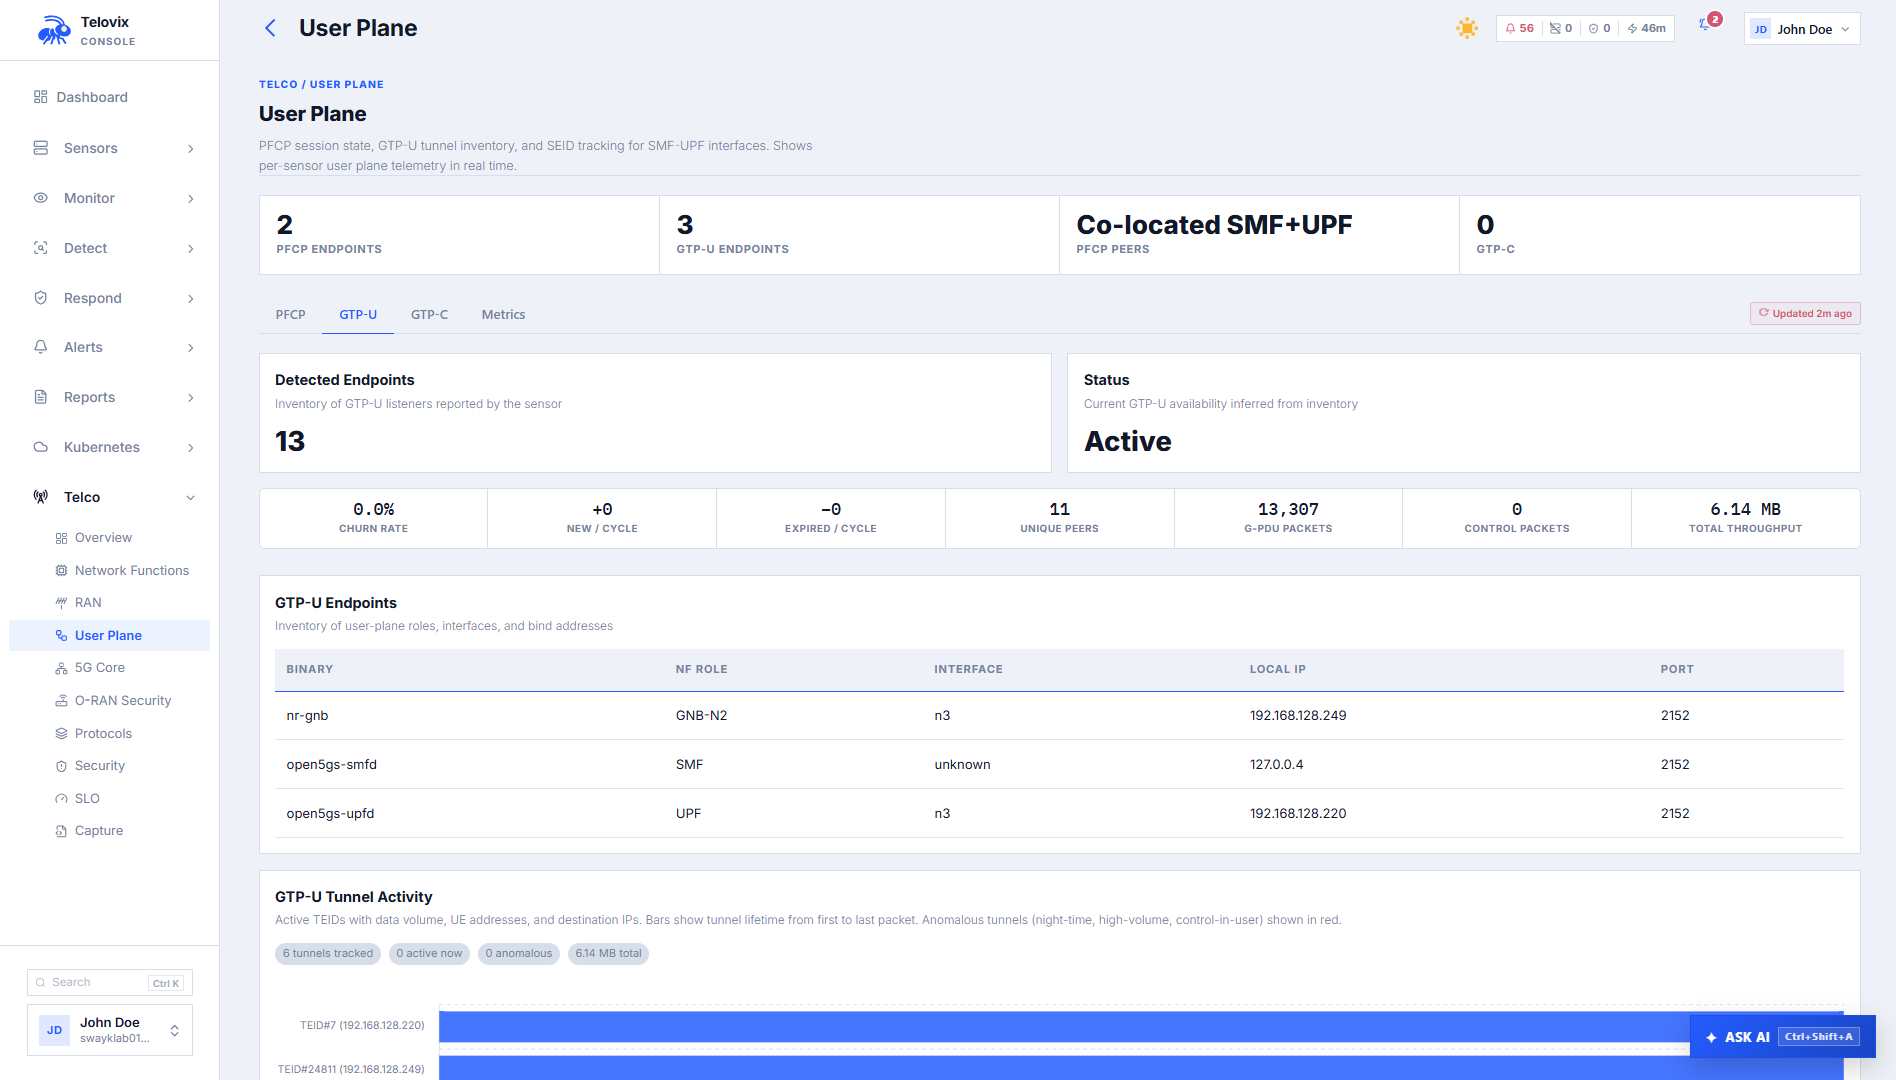
User-plane view
In the Console, go to Telco > User Plane. The page shows the current user-plane state across the fleet: PFCP session counts per UPF, active GTP-U tunnel counts, TEID anomaly counts, visibility gap flags, and per-node SLO status.
Filtering runtime events for user-plane roles
In the Console, go to Activity > Runtime Events. Use the NF Role filter to select upf and the time range selector to set the window. Add the Event Kind filter to narrow results to specific event types such as network_connect.
Protocol capture viewer
In the Console, go to Telco > Protocol Capture. The sensor includes a PCAPNG snapshot in the heartbeat payload for telecom nodes. The protocol capture viewer decodes and presents this snapshot for inspection, providing a short-window packet-level record of telecom protocol activity (GTP-U, PFCP, SCTP) at the time of the heartbeat.
AI assistant tools
The AI assistant provides two user-plane tools:
get_pfcp_sessions: Returns the current PFCP session state for a sensor or across the fleet: session count, state distribution, latency distribution, and recent anomalies.
get_gtpu_tunnels: Returns the GTP-U tunnel inventory: TEID count, endpoint roles (N3, N9, S1-U), anomaly flags, and visibility gap state.
Ask the AI assistant: "Show PFCP session state for UPF nodes."
SLO targets
Both UPF and SMF carry five-nines (99.999%) availability targets for user-plane functions:
| Role | SLO target |
|---|---|
| UPF | 99.999% |
| SMF | 99.999% |
| SGW | 99.999% |
| PGW | 99.999% |
Breach detection activates after 300 seconds of observation. Breach alerts are suppressed for 3,600 seconds to prevent re-alert storms.
4G compatibility
For 4G EPC deployments, the user-plane sensor behavior is identical with different interface labels:
| 5G | 4G equivalent |
|---|---|
| N4 (PFCP, SMF to UPF) | Sxa (SGW-C to SGW-U), Sxb (PGW-C to PGW-U) |
| N3 (GTP-U, gNB to UPF) | S1-U (GTP-U, eNB to SGW) |
| N9 (GTP-U, UPF to UPF) | S5/S8 (GTP-U, SGW to PGW) |
Role values for 4G nodes: sgw, pgw. PFCP anomaly detection applies to Sxa and Sxb the same way it applies to N4.
Operational guidance
Interface selection: If the UPF or SGW has multiple network interfaces, configure the monitoring interface in Console Settings to point to the interface carrying GTP-U and PFCP traffic. Using the wrong interface results in empty gtpu_inventory and pfcp_session_report fields in the heartbeat, with no error logged beyond the absence of data.
Kernel bypass UPFs: For production UPFs running AF_XDP or DPDK, expect gtp_visibility_gap=true on every heartbeat. Set a suppression rule for visibility_gap events on these specific sensors to avoid repeated alerts. The PFCP control-plane metrics remain valid and should still be monitored for session anomalies even when GTP-U visibility is limited.
Session churn threshold: The session churn anomaly fires when create/delete cycling exceeds a rate consistent with the baseline. During planned maintenance windows (bulk UE detach), the churn rate will spike. Use a time-bounded suppression rule to avoid noise during known maintenance windows.
Drop count monitoring: Monitor the drops field on UDP port 2152 listeners. A sustained non-zero drop count on a production UPF indicates receive buffer exhaustion. This is a pre-cursor to GTP-U packet loss that may not yet be visible in PFCP session metrics.
Limitations
- GTP-U data plane is invisible when kernel bypass is active: When a UPF uses AF_XDP, VFIO, or DPDK, the sensor cannot observe GTP-U encapsulated data packets via AF_PACKET. The sensor detects and flags this as
gtp_visibility_gap=true, but the packets themselves are not accessible. PFCP control-plane monitoring and all process-level eBPF collection remain unaffected. - PFCP monitoring requires the correct monitoring interface: If the sensor's configured monitoring interface does not carry PFCP traffic, session tracking will not function. There is no error logged when the interface is wrong; the absence of data in
pfcp_session_reportis the only signal. - GTP-U inner packet inspection is not supported: The sensor captures GTP-U tunnel metadata (TEID, endpoint roles, sequence numbers) and detects structural anomalies. It does not inspect or decode the subscriber IP packets carried inside GTP-U tunnels.
- Short-lived connections may not appear in the PFCP session view: Sessions that open and close between heartbeat cycles (within 15 seconds) may not be captured in the
pfcp_session_reportsnapshot. They may still appear asnetwork_flowevents if the sensor's flow tracker captured them. - Session churn baseline requires observation time: The session churn anomaly compares against an established baseline. During initial sensor deployment, the baseline is not yet built and the anomaly will not fire. Allow at least 14 days of observation before treating the absence of session churn alerts as meaningful.