

Fleet Management
Fleet Management is the operational inventory for every enrolled Telovix sensor. Use it to check current health, find a node, review deployment identity, inspect live system evidence, manage groups, start supported upgrades, and obtain the correct uninstall procedure.
Open Sensors > Fleet.
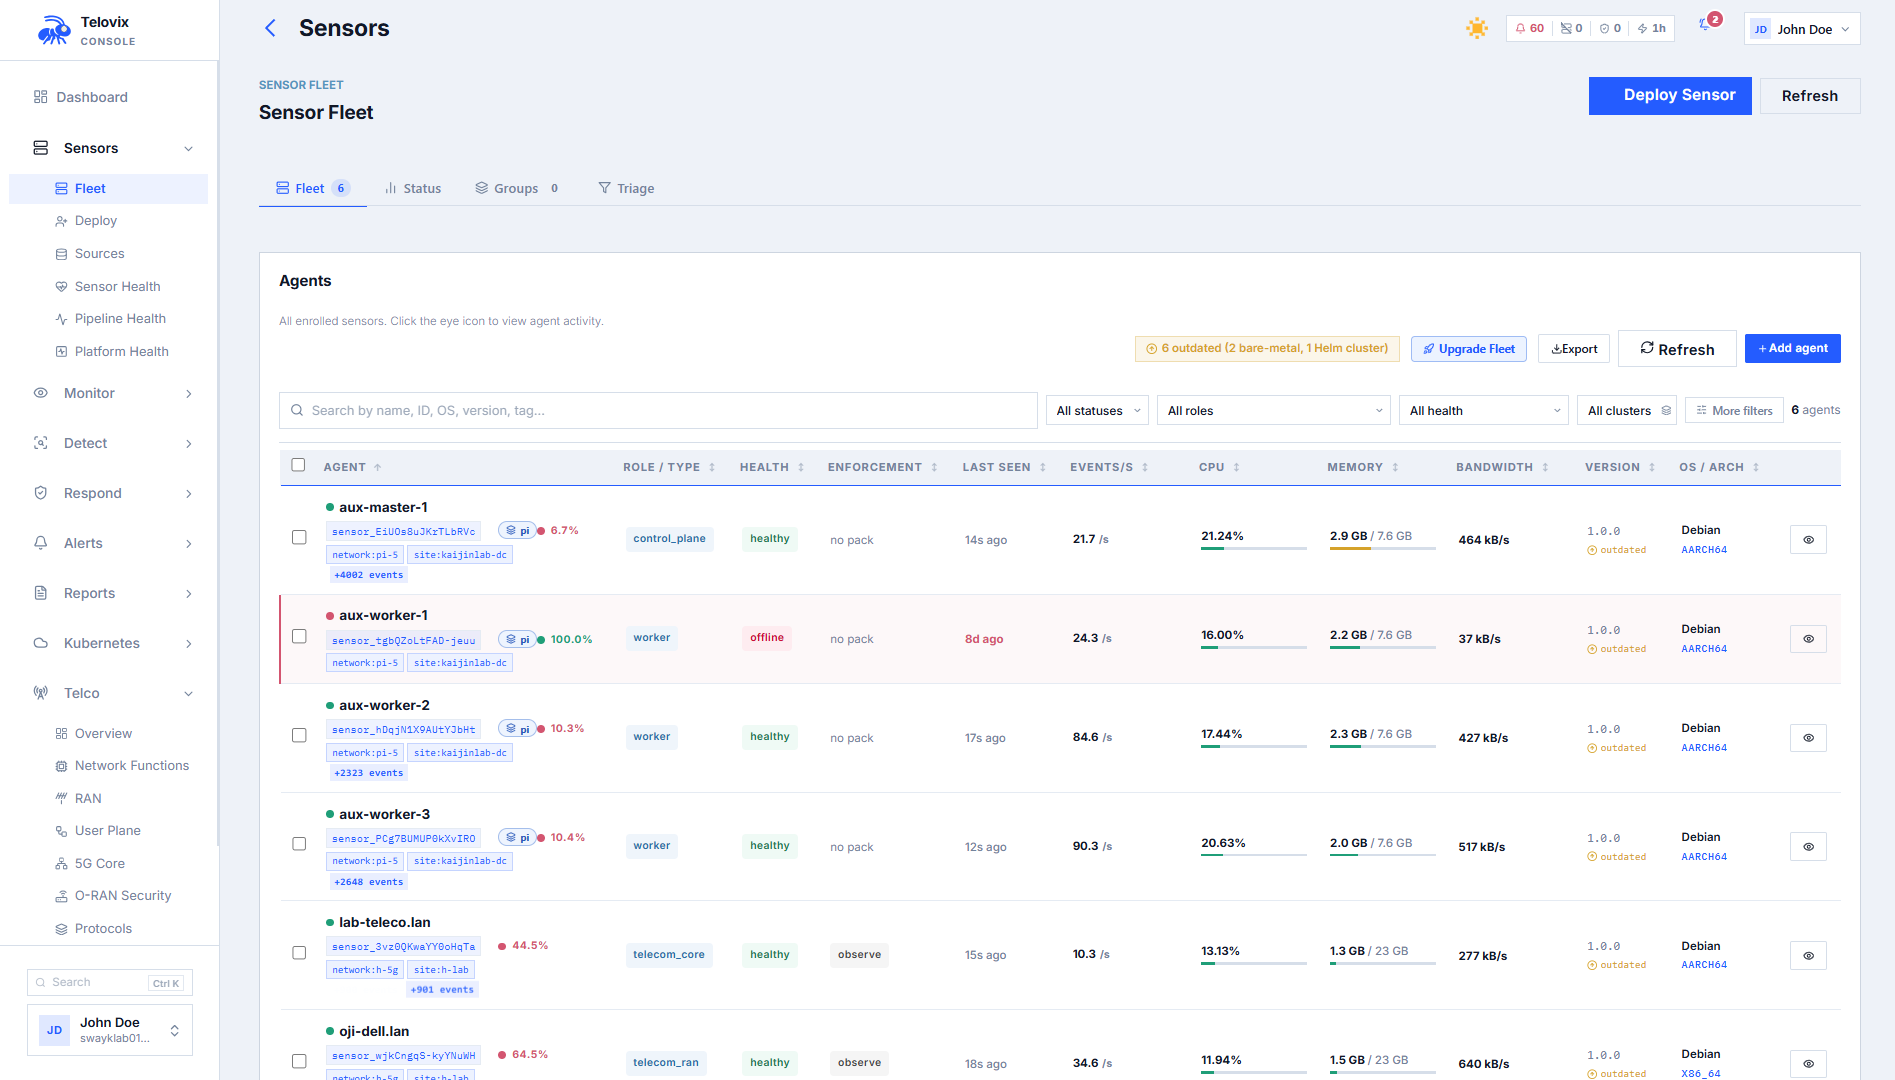
Fleet health
Fleet status updates automatically while the page is open. Use Refresh when validating a recent enrollment, restart, or upgrade immediately.
| State | Meaning |
|---|---|
| Healthy | The sensor is reporting within the expected window and has no active critical health condition. |
| Degraded | The sensor is reporting, but one or more health, delivery, trust, or coverage conditions need attention. |
| Stale | The latest report is older than the expected window. |
| Offline | The sensor has not reported for the offline threshold. |
| Revoked | Sensor trust has been revoked and normal operation is blocked. |
| Disabled | The sensor is intentionally disabled in the Console. |
Open Sensors > Health Center for pipeline, trust, and reporting diagnostics. Do not rely on a cached browser tab when validating current fleet state.
Search and filters
Search and filtering apply to the server-side fleet result set. Use them to find sensors by:
- node name or sensor ID;
- host, IP address, architecture, or operating system;
- Kubernetes cluster;
- deployment type;
- sensor flavor and version;
- network-function role;
- health or trust state;
- group or tag.
Large fleets are paginated. Narrow by cluster, group, role, health, or version before loading more pages.
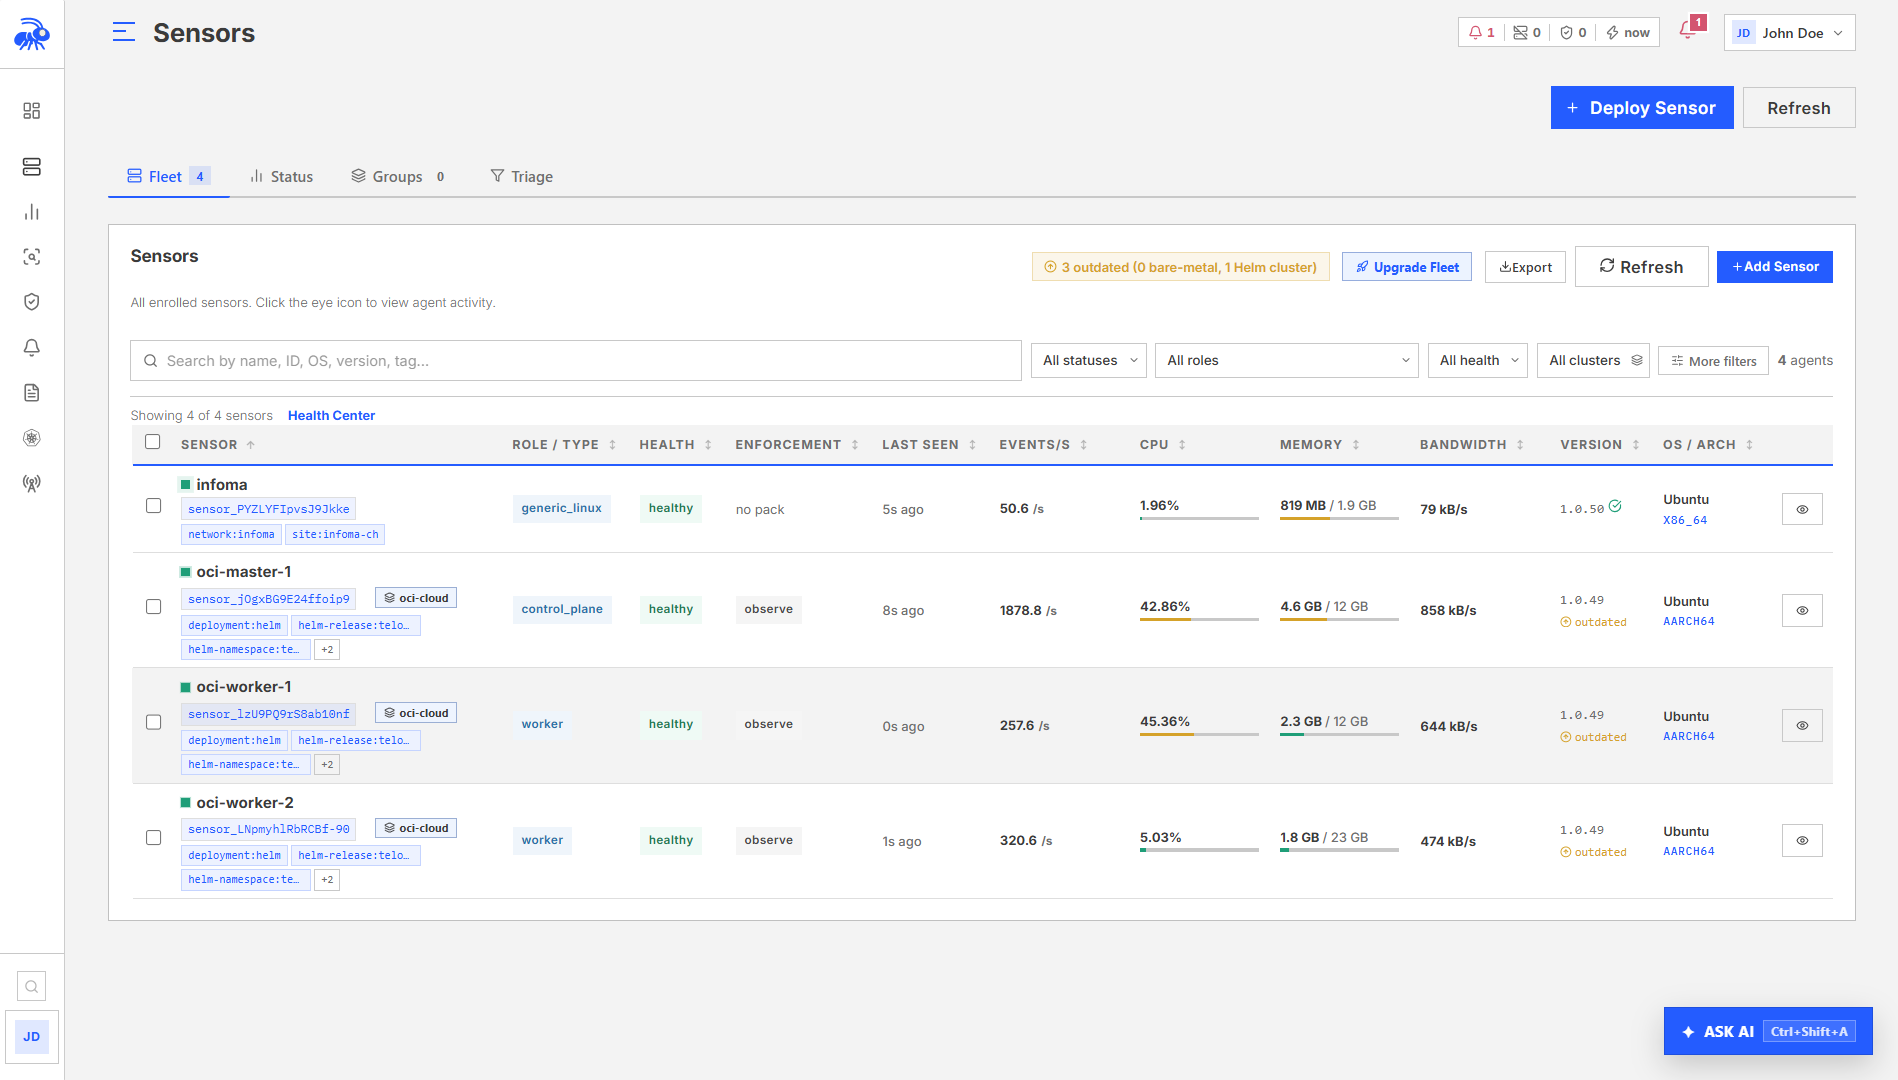
Select targets across a large fleet
When an action opens Sensor Selector, search sensor metadata to find the hosts you need before selecting targets. Selections remain available while you move between result pages or change the search.
Select page selects only the displayed page, not every matching sensor in the fleet. Review the selected-target count and list before confirming. The selector chooses individual sensors. Group targeting, where supported by an action, uses a separate control.
Tags and groups
Tags add operator-defined context such as:
network:prod-5g
site:tokyo-1
environment:production
role:upf
owner:core-platform
Groups collect sensors for protection targeting and access scope.
- Static groups contain sensors selected by an administrator.
- Dynamic groups use matching criteria such as tags, role, cluster, flavor, or architecture.
Review dynamic group membership before using it for enforcement. A metadata change can add or remove sensors from the group.
Sensor details
Select a sensor to open its expandable detail workspace.
Overview
Review identity, deployment type, host, version, flavor, trust, groups, tags, cluster, and recent reporting state.
Monitor
Use the subtabs for live node statistics, processes, network evidence, containers, and telecom network functions where applicable. Separate subtabs keep high-cardinality evidence bounded and easier to search.
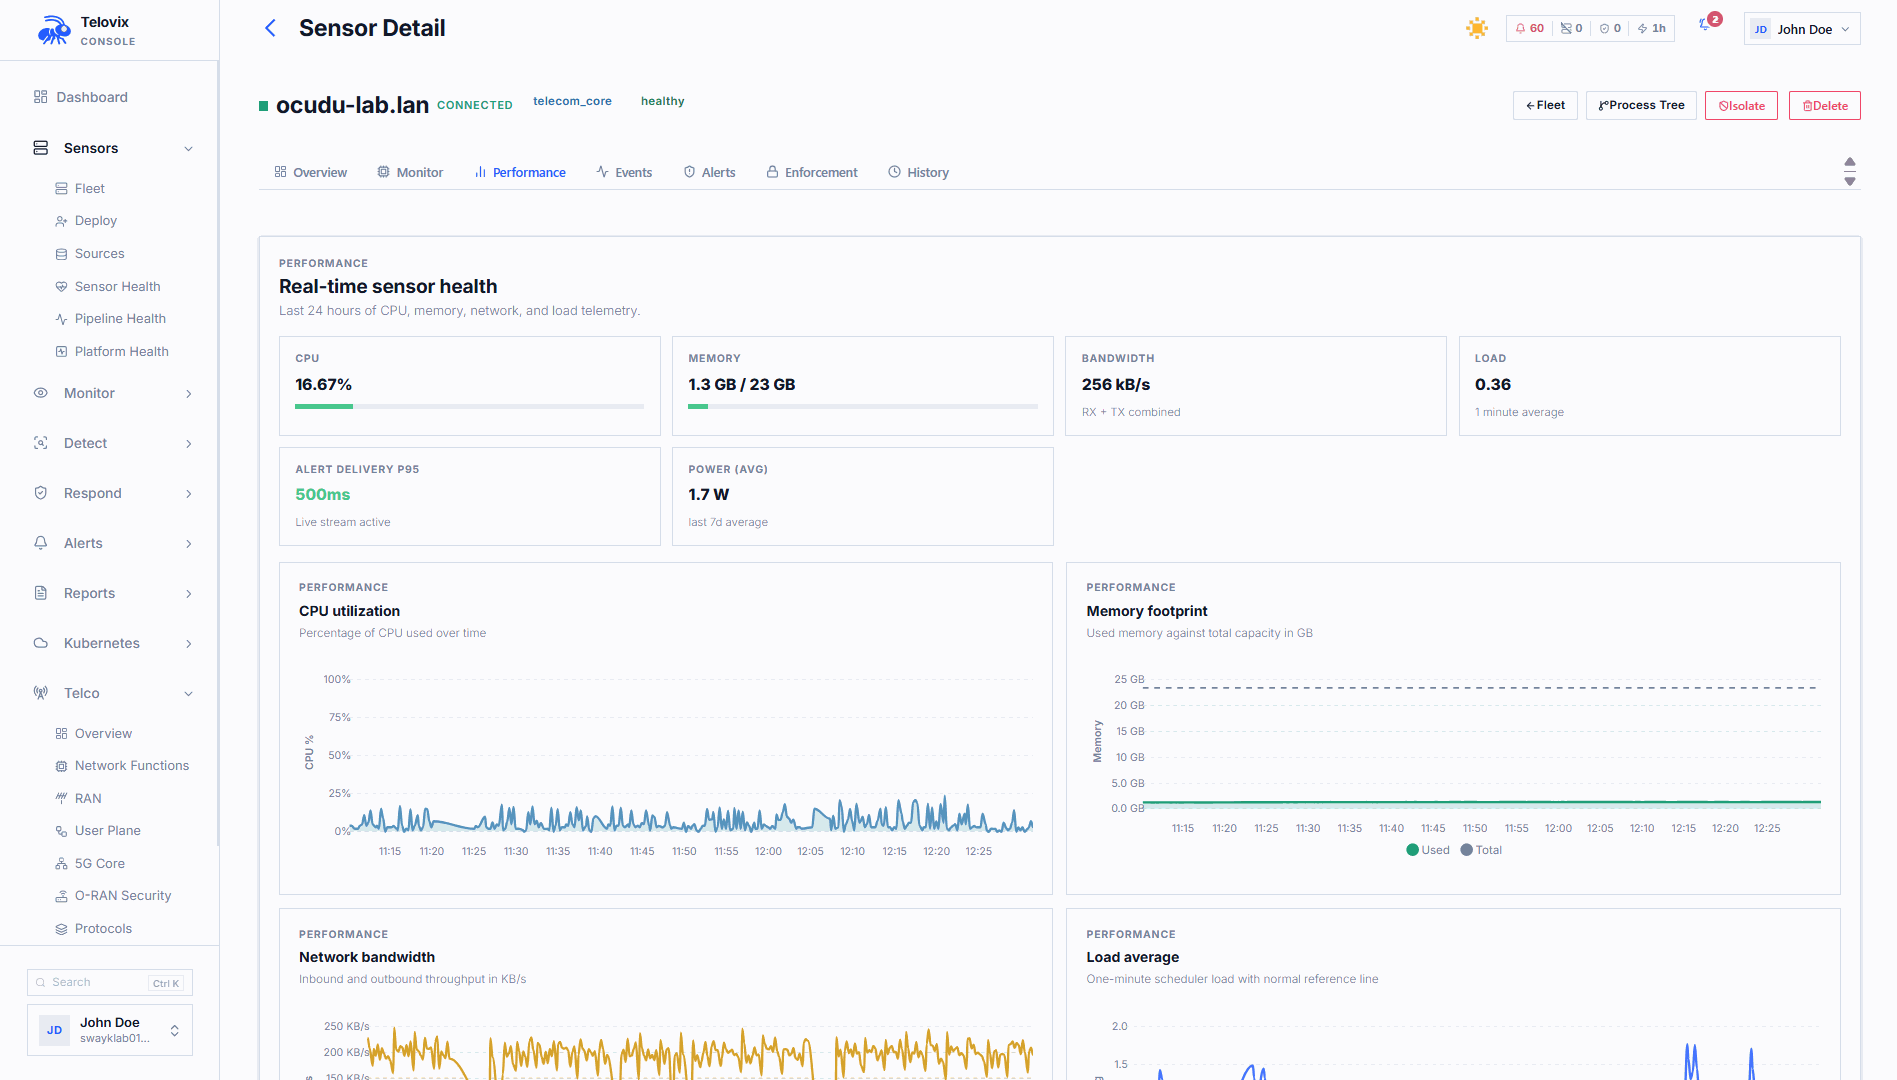
Performance
Performance shows CPU, memory, power, and temperature evidence when the host provides it. Temperature cards and charts are hidden when no reliable sensor is available. Power expands to use the available space and is labelled as measured or estimated.
Power estimates are useful for comparison and capacity planning; they are not a replacement for metered energy data.
Security and enforcement
Review trust, runtime blocks, delivery state, and relevant sensor capabilities before changing protection. Use Inspect policy to read an active rule. Open Runtime Blocks to edit its configuration.
Kubernetes-specific evidence appears only for Kubernetes deployments. A VM or bare-metal sensor does not show Kubernetes API activity solely because that feature exists in the Console.
Managed upgrades
Open Upgrade Fleet for the Bare metal and Kubernetes upgrade views. When no update is needed, use Manage updates to review setup and recent plans.
The Bare metal view offers Rolling, Canary, and Immediate strategies for the staged version. Starting a plan targets all eligible non-Kubernetes sensors; inventory search does not narrow that scope.
For Kubernetes, choose manual Helm, Managed rollout, Flux, or Argo CD setup. Managed updates require a registered controller; GitOps updates also require repository automation.
See Upgrading Sensors for setup, eligibility, progress, and recovery. Automatic workflows do not offer arbitrary downgrades.
Uninstall a sensor
Open the sensor Overview and select Uninstall this sensor. Telovix shows instructions based on the deployment type.
| Deployment | Expected guidance |
|---|---|
| Kubernetes or K3s with Helm | Run the displayed Helm uninstall command for the release and namespace from a cluster administrator machine. Do not delete only one DaemonSet pod; it will be recreated. |
| Kubernetes or K3s with Flux or Argo CD | Retire the deployment through its owning GitOps source and controller, then verify removal. Do not use a standalone Helm uninstall for a GitOps-owned deployment. |
| VM or bare metal | Run the displayed curl or wget uninstall command on the sensor host. |
| Ephemeral VM | Remove the sensor through the image, instance group, or infrastructure template that owns the instance, then retire its Console record when appropriate. |
Review the release name, namespace, Console URL, and sensor identity before executing an uninstall command.
Uninstalling software does not automatically delete historical security evidence. Disabling or revoking a sensor record is a separate administrative action.
Recommended fleet workflow
- Filter for degraded, stale, offline, or version-drifted sensors.
- Open each sensor and identify deployment type and last report time.
- Resolve trust or delivery problems before changing policy or version.
- Group sensors by operational role and maintenance scope.
- Use a canary strategy for supported upgrades; apply enforcement to a small test scope before expanding it.
- Confirm health after each wave.
- Review Audit Log for administrative changes.
Troubleshooting
| Symptom | Check |
|---|---|
| A newly deployed sensor does not appear | Confirm enrollment succeeded, Console URL and trust are correct, and the service or pod is running. |
| Health looks stale until refresh | Confirm the browser can maintain live updates; use Refresh and compare with Health Center. |
| Temperature is absent | The host did not provide reliable temperature evidence. This is expected on some VMs and hardware. |
| Power is estimated | The platform did not provide direct power telemetry. Use the estimate for trend comparison only. |
| Upgrade remains pending | Confirm the sensor is online, eligible, and not already at the target version. |
| Kubernetes uninstall command fails | Verify Helm release name and namespace with helm list -A. |
| A sensor reappears after uninstall | Remove it from the deployment controller, image, DaemonSet, instance group, or provisioning template that recreated it. |