Runtime Inspector
The Runtime Inspector provides a live snapshot view of what is currently happening on one or more sensors. It polls the Console every 5 seconds and displays the most recently reported process state, network connections, listening services, and recent activity events. This is distinct from the historical event query view. The Inspector shows the current state at the time of the last heartbeat, not a filtered view of past events.
Sensor selection
When the fleet contains more than 10 sensors, the Inspector requires explicit sensor selection before loading any data. This prevents accidentally loading process snapshots from the entire fleet.
A maximum of 5 sensors can be inspected simultaneously. If more than 5 are selected, the view uses the first 5.
Tabs
The Inspector has seven tabs, each drawing from a different data source:
| Tab | Label | What it shows |
|---|---|---|
| Process Tree | Process Tree | Current process snapshot sorted by PID hierarchy |
| Top Processes | Top Processes | Processes sorted by CPU or memory |
| System Activity | System Activity | Recent runtime events from the sensor |
| Network Connections | Network Connections | Current ESTABLISHED TCP connections |
| Red Flags | Red Flags | Events that warrant immediate review (warning/high/critical severity) |
| Listening Services | Listening Services | Current LISTEN state TCP sockets |
| Containers | Containers | Container processes grouped by workload |
Process snapshot
The process tree and top processes tabs read from the same proc snapshot collected at the sensor's last heartbeat. The snapshot is built from /proc polling on the sensor host.
In the Console, navigate to Runtime Inspector, select a sensor, and open the Process Tree or Top Processes tab.
Each process entry includes:
| Field | Description |
|---|---|
pid, ppid | Process and parent process IDs |
name | Process name (basename of binary) |
binary_path | Full binary path |
cmdline | Command-line string |
uid, effective_uid | Real and effective user IDs |
state | Process state (R, S, D, Z, T) |
threads | Thread count |
cpu_percent | CPU usage percentage |
mem_rss_kb | Resident set size in KB |
mem_virt_kb | Virtual memory size in KB |
mem_shr_kb | Shared memory in KB |
mem_percent | Memory as percentage of total |
cpu_time_secs | Cumulative CPU time |
workload_id, workload_type | Kubernetes workload attribution (if Kubernetes polling is enabled) |
The container tab uses workload_id to group processes by their Kubernetes workload, showing which container a process belongs to.
Network connections and listening services
Active connections and listening services are read directly from the heartbeat snapshot (taken from /proc/net/tcp and /proc/net/tcp6 at heartbeat time).
In the Console, navigate to Runtime Inspector, select the sensor, and open the Network Connections or Listening Services tab. See Network View for full documentation on the underlying data.
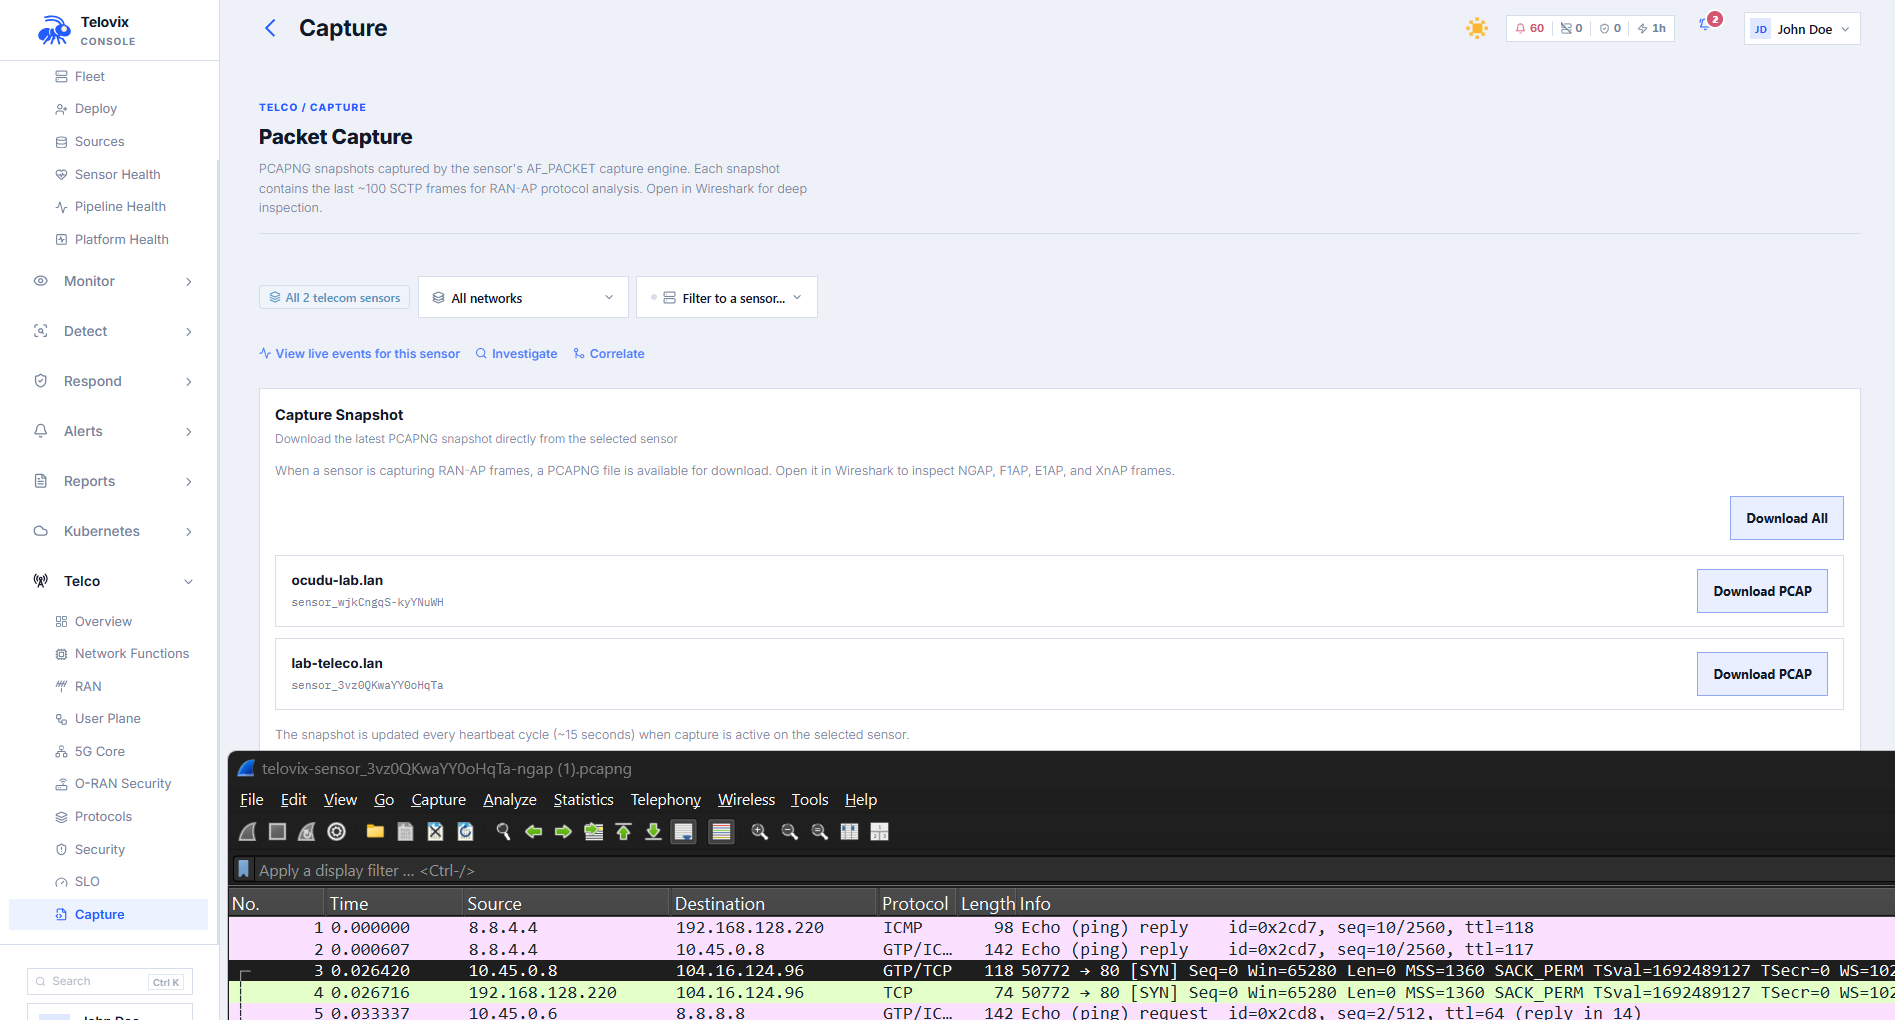
Protocol capture (PCAPNG)
For telecom sensors that have sent a protocol capture snapshot in a recent heartbeat, a PCAPNG file is available for download.
In the Console, navigate to Runtime Inspector, select the telecom sensor, and click Download Protocol Capture. The file downloads as telovix-{sensor_id}-ngap.pcapng and can be opened directly in Wireshark.
Limitations of protocol capture:
- The Console stores PCAPNG snapshots in memory for at most 10 sensors at a time. When a new sensor sends a capture, the oldest stored snapshot is evicted if the limit is reached.
- A capture is only available if the sensor's telecom flavor has sent a
pcapng_snapshot_b64field in a recent heartbeat. Not all telecom deployments include a capture snapshot. - The stored snapshot reflects the last capture received. There is no historical archive.
Live Feed
The Live Feed page streams events from all sensors in real time. Events are broadcast from an in-memory channel populated by sensor heartbeats. The channel capacity is 65,536 messages; slow clients that fall behind will receive a lag notification and may miss events.
In the Console, navigate to Runtime Inspector > Live Feed. Use the filter controls to narrow the stream by sensor, event kind (substring match, case-insensitive), severity, or a text search on the event message.
Polling vs streaming
The Runtime Inspector polls the Console every 5 seconds using normal HTTP requests. It does not use the SSE stream. The Live Feed page uses the SSE stream for push-based delivery.
| View | Delivery model | Latency |
|---|---|---|
| Runtime Inspector | HTTP polling every 5 seconds | Up to 5 seconds + heartbeat latency |
| Live Feed | SSE stream | Near real-time (delivered as events arrive from heartbeat) |
Limitations
- Process snapshot data reflects the
/procstate at the sensor's last heartbeat. Processes that started and stopped between heartbeats will not appear. Use the Events view for historicalprocess_execrecords. - The process snapshot includes all processes visible to the sensor, including kernel threads. These appear with
[square bracket]names in thenamefield. - The Inspector truncates to the first 5 selected sensors. Multi-sensor comparison is limited to 5 nodes simultaneously.
- SSE clients that cannot consume events fast enough will lag. The broadcast channel capacity is 65,536 messages. Lagging clients receive a warning and may miss events that were in the dropped messages.