

Telecom Capture
Telco Capture creates a focused PCAPNG file from one telecom sensor. Use it when protocol summaries are not enough and an engineer needs packet-level evidence for a specific node, interface, network namespace, or incident window.
Capture is bounded by duration and size. It is not a continuous fleet-wide packet recorder.
Before you begin
- Deploy the telecom sensor flavor on the target node.
- Confirm the sensor is healthy and belongs to the expected telecom network.
- Use an Admin or Operator account to start, stop, or download a capture.
- Select the narrowest sensor and target scope that can answer the investigation question.
Navigate to Telco > Assurance > Packet Capture.
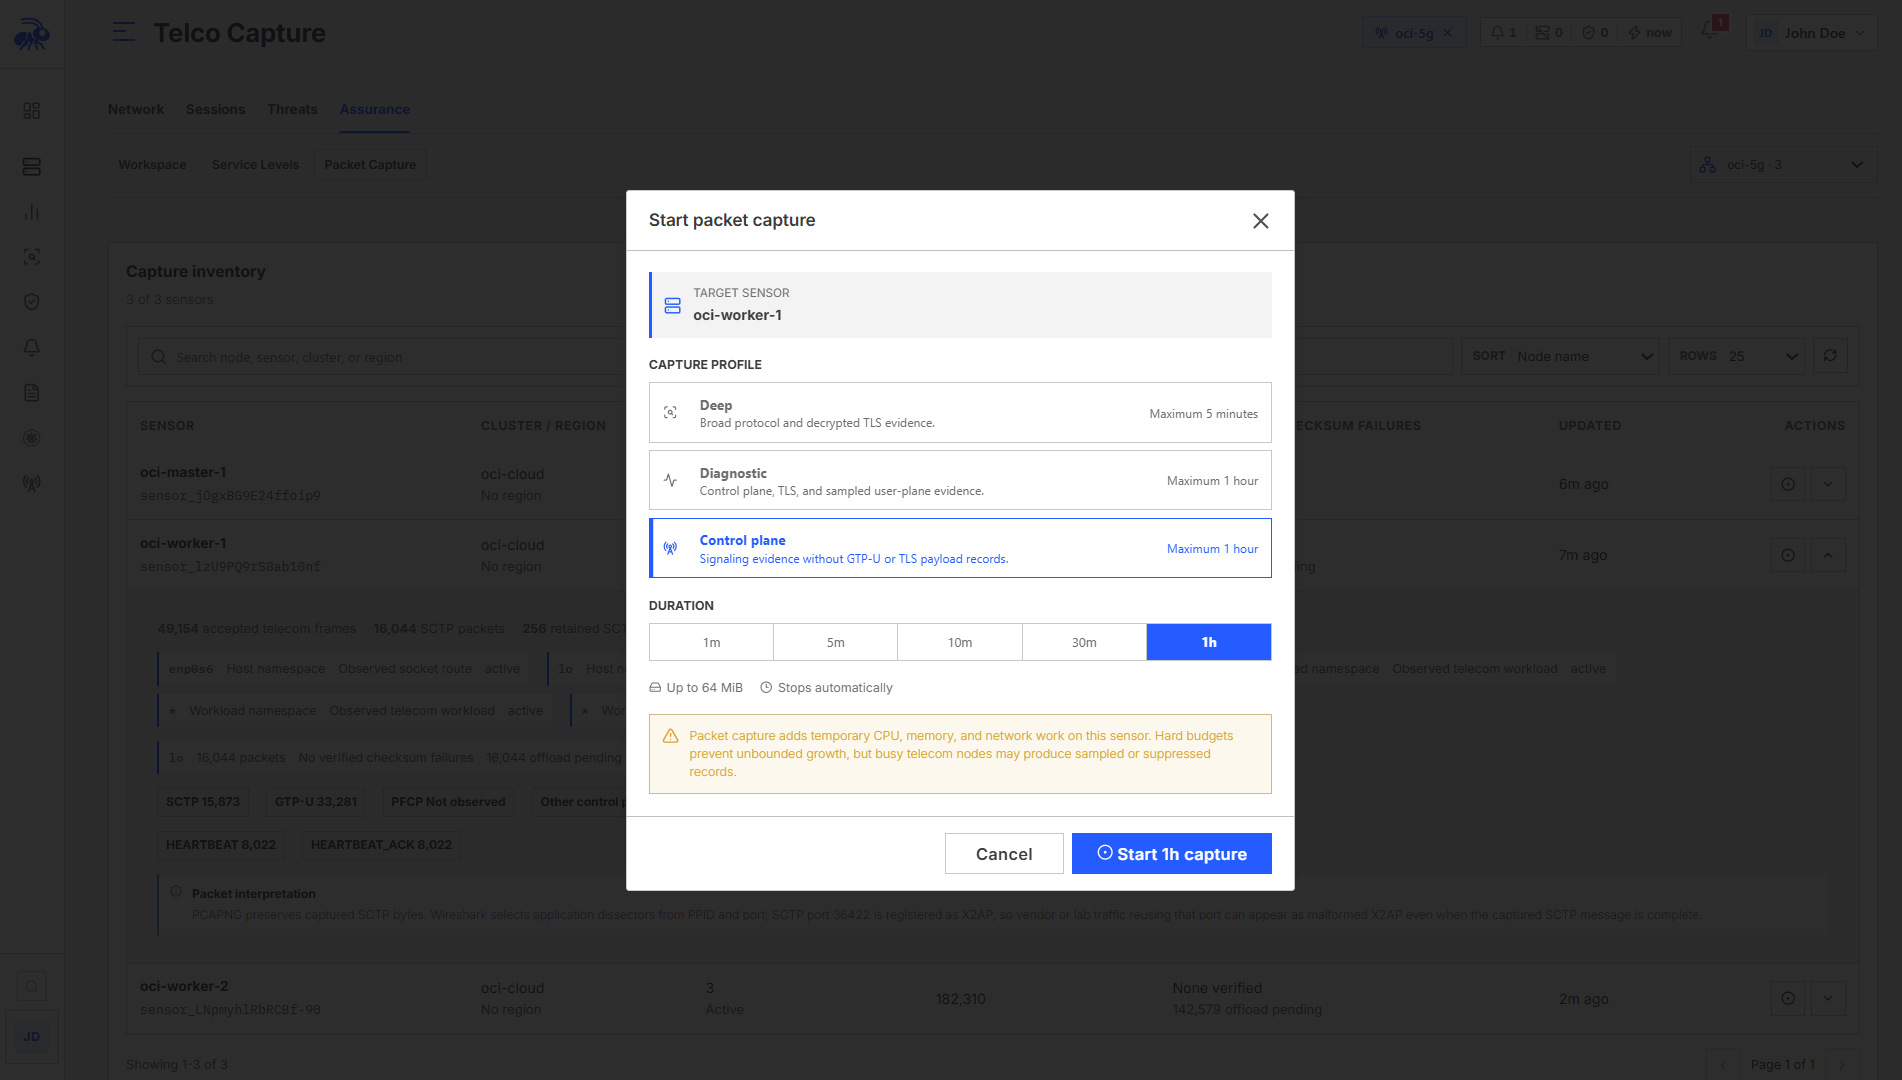
Choose a capture profile
| Profile | Best for | Available duration |
|---|---|---|
| Diagnostic | Balanced troubleshooting across control-plane protocols, decrypted TLS evidence, and sampled user-plane traffic. | 1, 5, 10, 30, or 60 minutes |
| Control plane | Signaling investigations where GTP-U and TLS payload evidence are not required. | 1, 5, 10, 30, or 60 minutes |
| Deep | Short, detailed protocol and decrypted TLS investigation on a tightly scoped target. | 1 or 5 minutes |
Use Diagnostic unless the investigation has a clear reason to prefer another profile. Deep capture is intentionally limited to short sessions because it can produce substantially more evidence.
Start a capture
- Select the target sensor.
- Choose Diagnostic, Control plane, or Deep.
- Choose the duration.
- Review the selected interfaces and network namespaces.
- Start the capture.
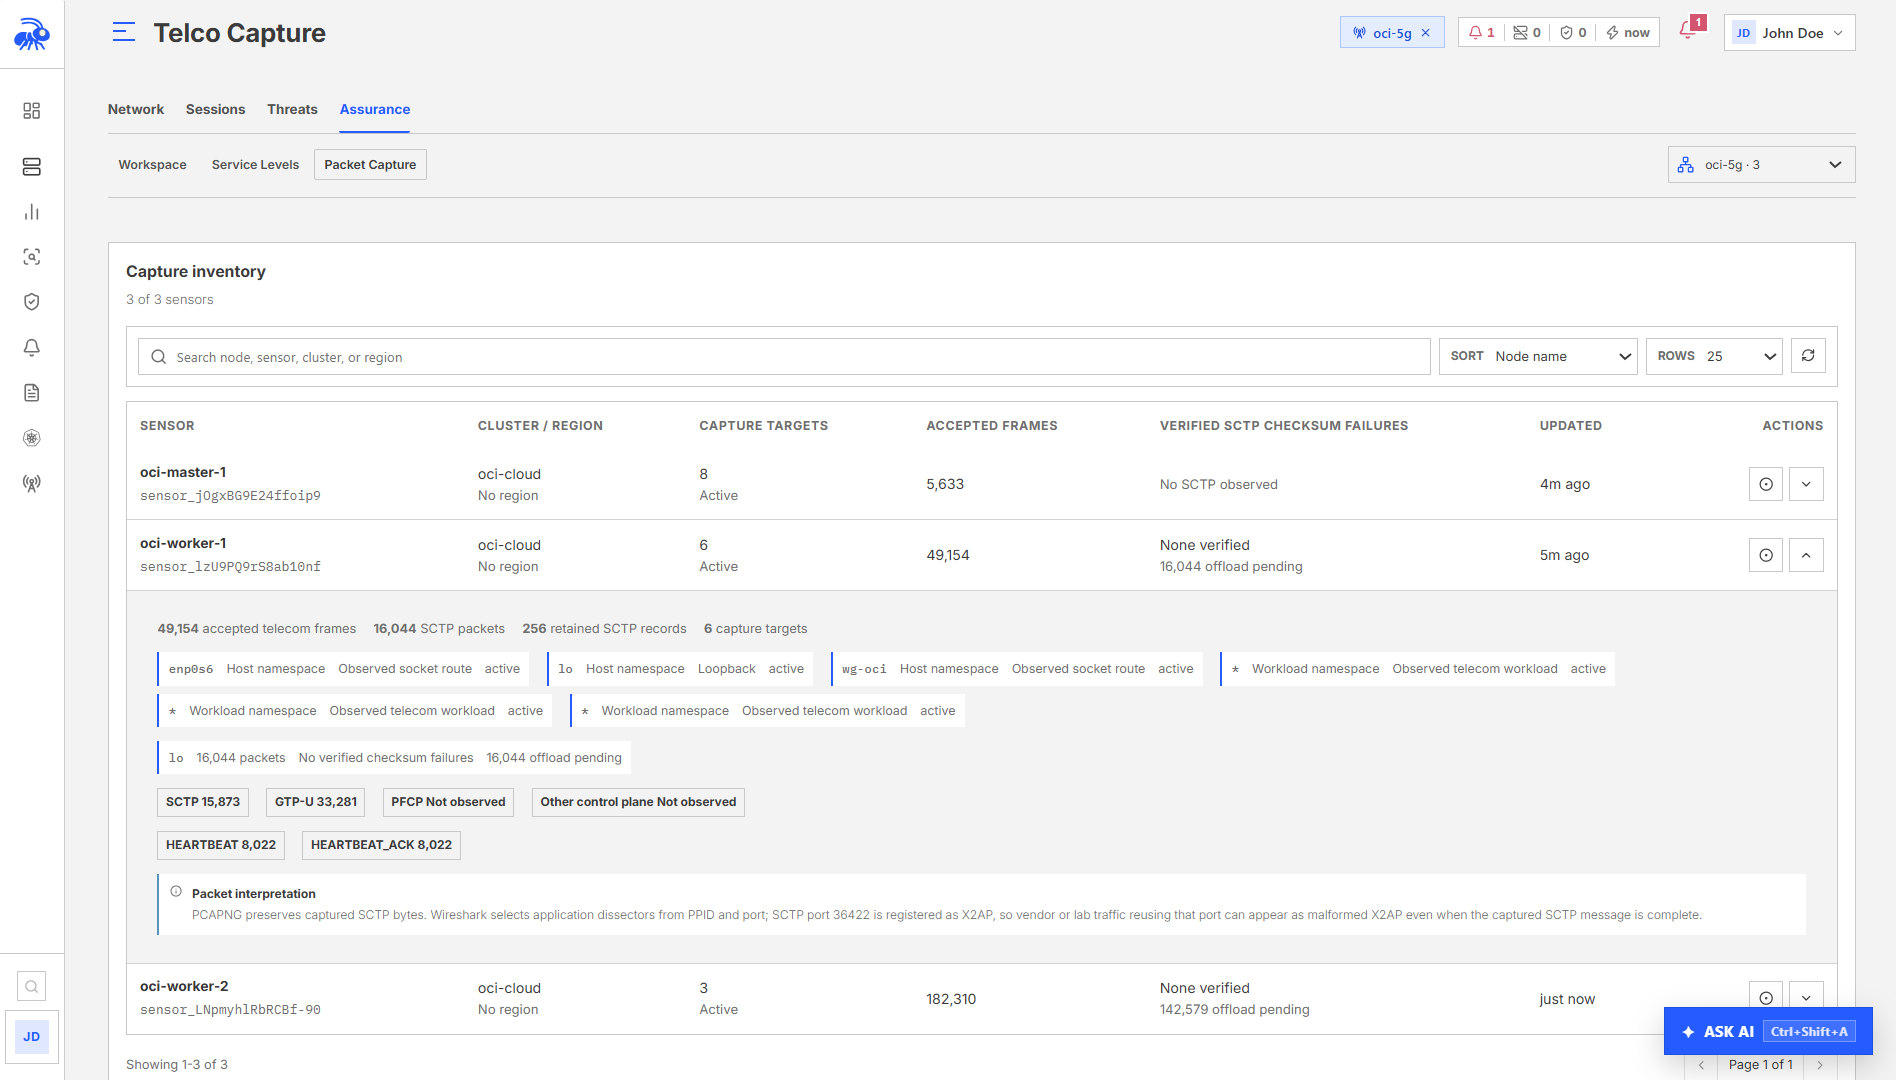
The capture card shows its current state, elapsed time, captured records, protocol evidence, decrypted TLS records, and any budget or coverage limitation.
Starting a capture does not change the sensor's normal detection policies. However, packet capture consumes additional CPU, memory, and storage while active. Avoid overlapping captures on a busy node unless the incident requires it.
Target interfaces and namespaces
Telovix displays the interfaces and network namespaces included in the capture. Review them before relying on an empty result.
If expected traffic is missing:
- confirm the network function is running on the selected sensor;
- confirm the traffic uses one of the displayed interfaces or namespaces;
- check whether the workload uses a kernel-bypass path;
- check the profile and protocol counters for unsupported, lost, or budget-limited evidence.
A capture that includes only lo reflects traffic observed on the loopback interface during that session. It does not mean the node has no other interfaces.
Stop and download
You can stop an active capture before its selected duration expires. Download becomes available after the sensor finalizes the capture and at least one segment has been stored.
- Select Stop capture if the required evidence has been collected.
- Wait for the state to change to completed or stopped.
- Select Download PCAPNG.
- Open the file in Wireshark.
Do not treat a capture as complete while it is still finalizing.
Understand the evidence
| Evidence | Meaning |
|---|---|
| Accepted protocol frames | Frames recognized for the selected telecom profile. |
| Decrypted TLS records | Plaintext records observed for supported TLS traffic during this capture. |
| Budget reached | The capture hit its configured record, byte, or time limit. The file remains valid but is partial. |
| Lost or suppressed | Some eligible evidence could not be included. Use the counters when interpreting the file. |
| Unsupported | The traffic path or protocol could not be represented by the selected capture. |
A decrypted TLS count of zero means that no supported TLS plaintext was observed during the capture. It does not prove that all encrypted traffic was decrypted or that TLS processing failed.
Wireshark guidance
Telovix preserves SCTP packet bytes in PCAPNG. If Wireshark labels vendor or lab traffic on a non-standard port with the wrong dissector, use Analyze > Decode As and select the protocol that matches the interface under investigation.
Decrypted TLS evidence is exported as Wireshark Upper PDU records. Inspect the packet details to see the decoded application protocol. Telovix includes only plaintext that the selected sensor actually observed during the capture window.
For 5G investigations, useful display filters include:
ngap || pfcp || gtp || http2 || diameter || s1ap || x2ap || e2apThe exact set of decoded protocols depends on the traffic, profile, Wireshark version, and installed dissectors.
Capture states
| State | Action |
|---|---|
| Requested | Wait for the selected sensor to accept the request. |
| Active | The sensor is collecting evidence. Stop it when enough evidence is available. |
| Finalizing | Wait before downloading. |
| Completed | Download the PCAPNG file. |
| Stopped | Download if at least one segment was stored. |
| Failed | Open the failure reason, verify sensor health and target coverage, then start a new capture. |
| Expired | Start a new capture if the evidence is still required. |
Troubleshooting
| Symptom | Check |
|---|---|
| No capture telemetry for a sensor | Confirm telecom flavor, sensor health, network selection, and that the node has reported capture capability. |
| No snapshot or no packets | Verify the selected interface and namespace, then generate known traffic during a short Diagnostic capture. |
| Many checksum warnings | Check whether transmit or receive checksum offload is enabled. Offloaded packets may be observed before the network interface completes checksum work. |
| No decrypted TLS records | Confirm TLS traffic occurred during the window and review TLS Visibility for supported evidence states. |
| Download remains unavailable | Wait for finalization and confirm at least one capture segment was stored. |
| File looks truncated | Check the capture duration, byte and record counters, and any budget-reached status. |