

API Security
API Security presents the APIs that Telovix has observed at runtime and connects them to their callers, destinations, workloads, processes, threats, and API contracts. Use it to understand the real attack surface, investigate suspicious requests, and verify whether monitoring coverage is sufficient for a conclusion.
The same workspace covers Kubernetes, standalone containers, hosts, services, processes, and external API destinations. A cluster opened from Kubernetes > Kubernetes Fleet uses the same workspace with the cluster scope already applied.
Open the workspace
Navigate to Detect > API Security.
The page has four primary views:
| View | Use it to |
|---|---|
| Overview | Review API posture, exposure, current threats, and the applications that need attention. |
| Inventory | Explore applications, services, endpoints, callers, and destinations as a list or relationship map. |
| Threats | Triage API findings and open the request, response, runtime, and relationship evidence behind each finding. |
| Controls | Manage gateway policies and API contracts, including observed contract drift and lifecycle state. |
The platform, scope, time range, search, and filters remain available as you move between views. Use them before opening evidence when investigating a specific cluster, host, workload, or sensor.
Overview
Overview is the starting point for posture review. It summarizes observed APIs, external exposure, sensitive or high-risk APIs, new or shadow APIs, and active threats for the selected scope and time range.
Use the page interactively:
- Select a metric to open the matching Inventory or Threats result set.
- Select an application or relationship in the map to inspect its callers, destinations, and endpoints.
- Select an item in Needs Attention to open its evidence or a filtered investigation view.
- Change the time range before comparing current activity with an earlier period.
If historical evidence is insufficient, Telovix shows that state instead of presenting a trend as fact.
Inventory
Inventory groups observed endpoints by the application or service that owns them. The hierarchy adapts to the deployment platform:
| Platform | Typical hierarchy |
|---|---|
| Kubernetes | Cluster, namespace, workload or service, endpoint |
| Containers | Host, runtime, container or application, endpoint |
| Bare metal | Host, service or process, endpoint |
| External | Observed caller, external destination, endpoint |
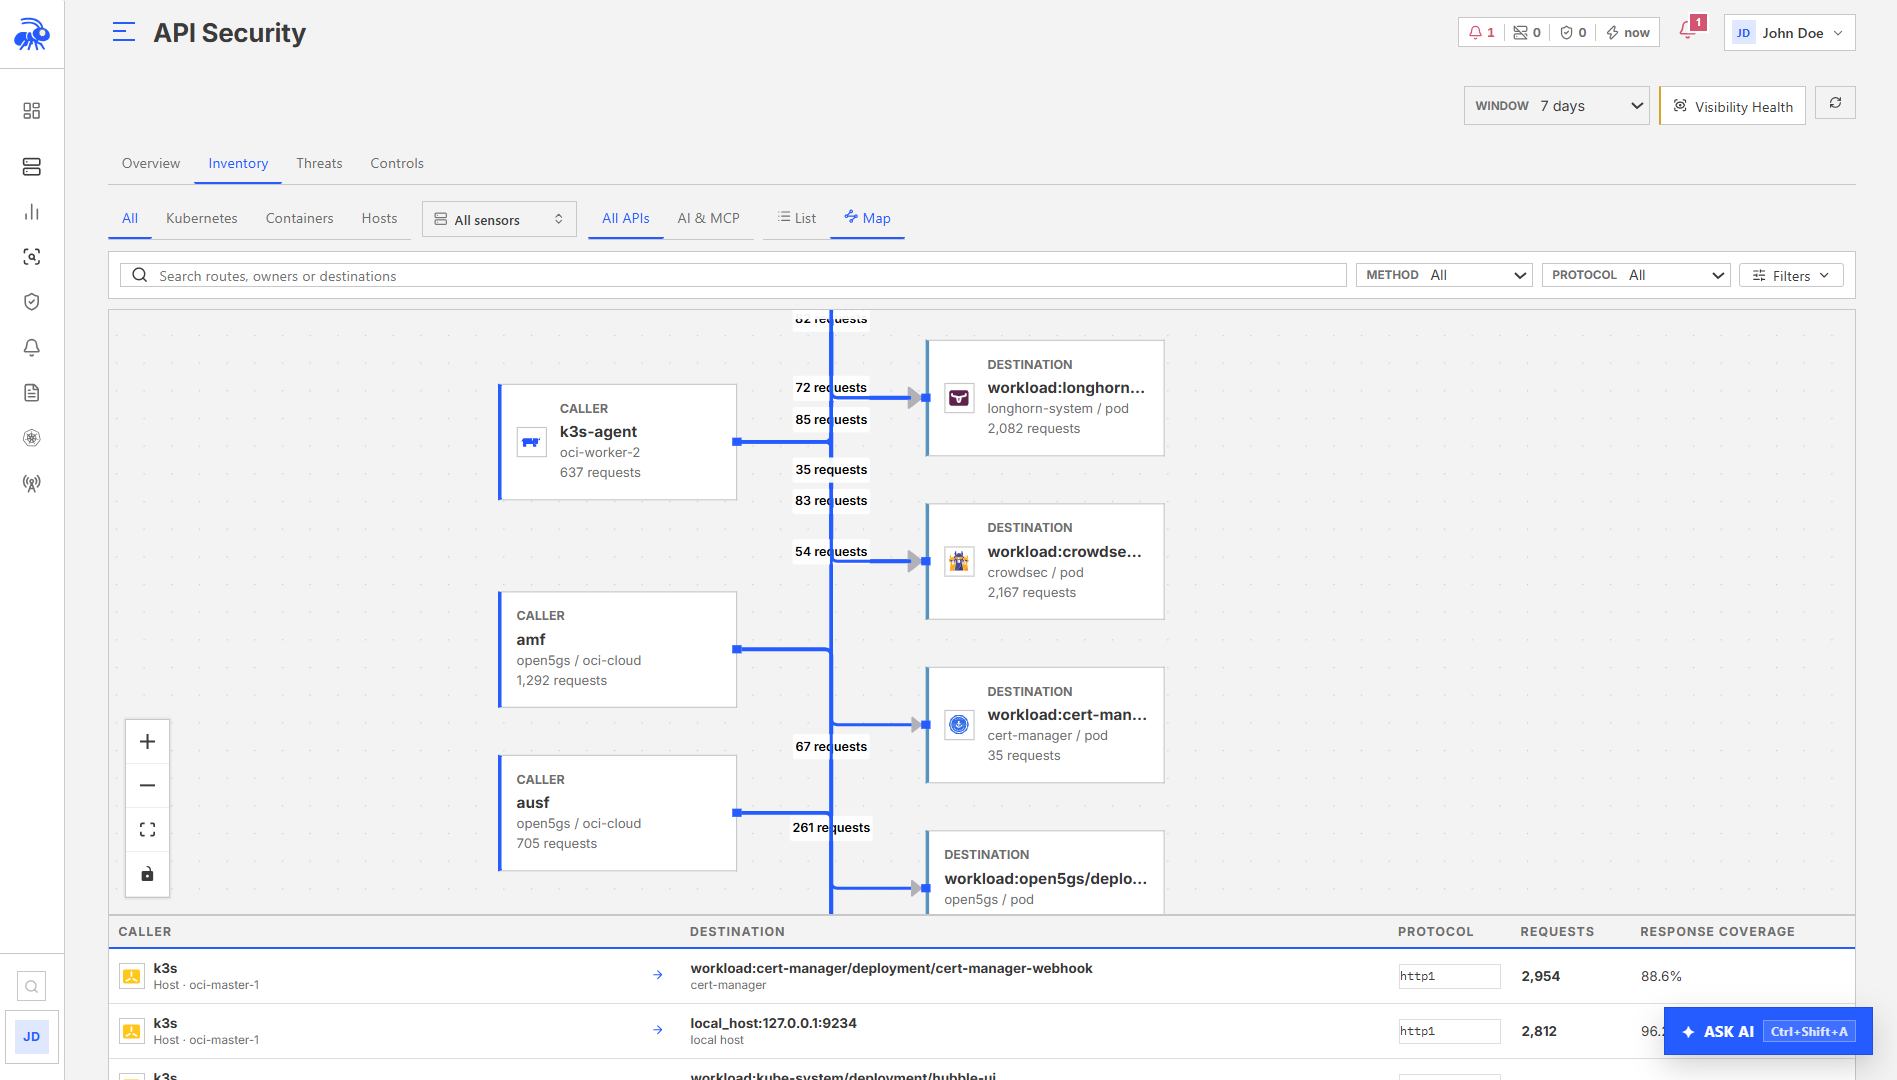
Switch between List and Map:
- List is best for filtering, sorting, comparing endpoints, and opening exact evidence.
- Map is best for understanding application-to-application and application-to-external relationships.
The AI and MCP lens keeps the same inventory but applies fields and filters relevant to AI gateways, model APIs, MCP servers, and clients. It is not a separate source of evidence.
Useful filters
Filters include platform, scope, exposure, lifecycle, method, protocol, risk, authentication, sensitivity, technology, destination, encoding, streaming, and inspection outcome. Search and filtering apply to the full server-side result set, not only the rows currently visible.
Large inventories are paginated. Narrow the scope or add filters before opening high-volume applications.
Endpoint labels
Telovix labels common operational routes such as root, health, readiness, liveness, and metrics so repetitive infrastructure traffic is easier to distinguish from business APIs. External and unresolved destinations are also marked explicitly.
An Unresolved destination means Telovix observed the API call but could not attach the destination to a known service, container, host, or external identity from the available evidence. The endpoint remains valid and searchable.
Threats
Threats combines posture summaries with a prioritized findings queue. Use the severity, category, application, endpoint, exposure, confidence, and time filters to reduce the queue before triage.
Selecting a finding opens the standard evidence panel. Confirm the following before changing its status:
- The highlighted request or response evidence matches the reported indicator.
- The affected endpoint and observed caller-to-destination relationship are correct.
- Runtime identity points to the expected process, container, workload, and sensor.
- The finding confidence and occurrence history support the conclusion.
- Visibility Health does not report a material gap for the required evidence.
Use Inspect matched request when available to open the observation associated with a finding. This avoids searching unrelated requests to the same endpoint. The Security tab explains the indicator and highlights available matching content.
A risk badge is based on qualifying findings, not simply an endpoint's request volume or external destination. Read the summary explanation and evidence before acting. No badge is not proof that an endpoint is secure.
Passive indicators are evidence of suspicious input or behavior. They are not automatically proof that exploitation succeeded.
Evidence panel
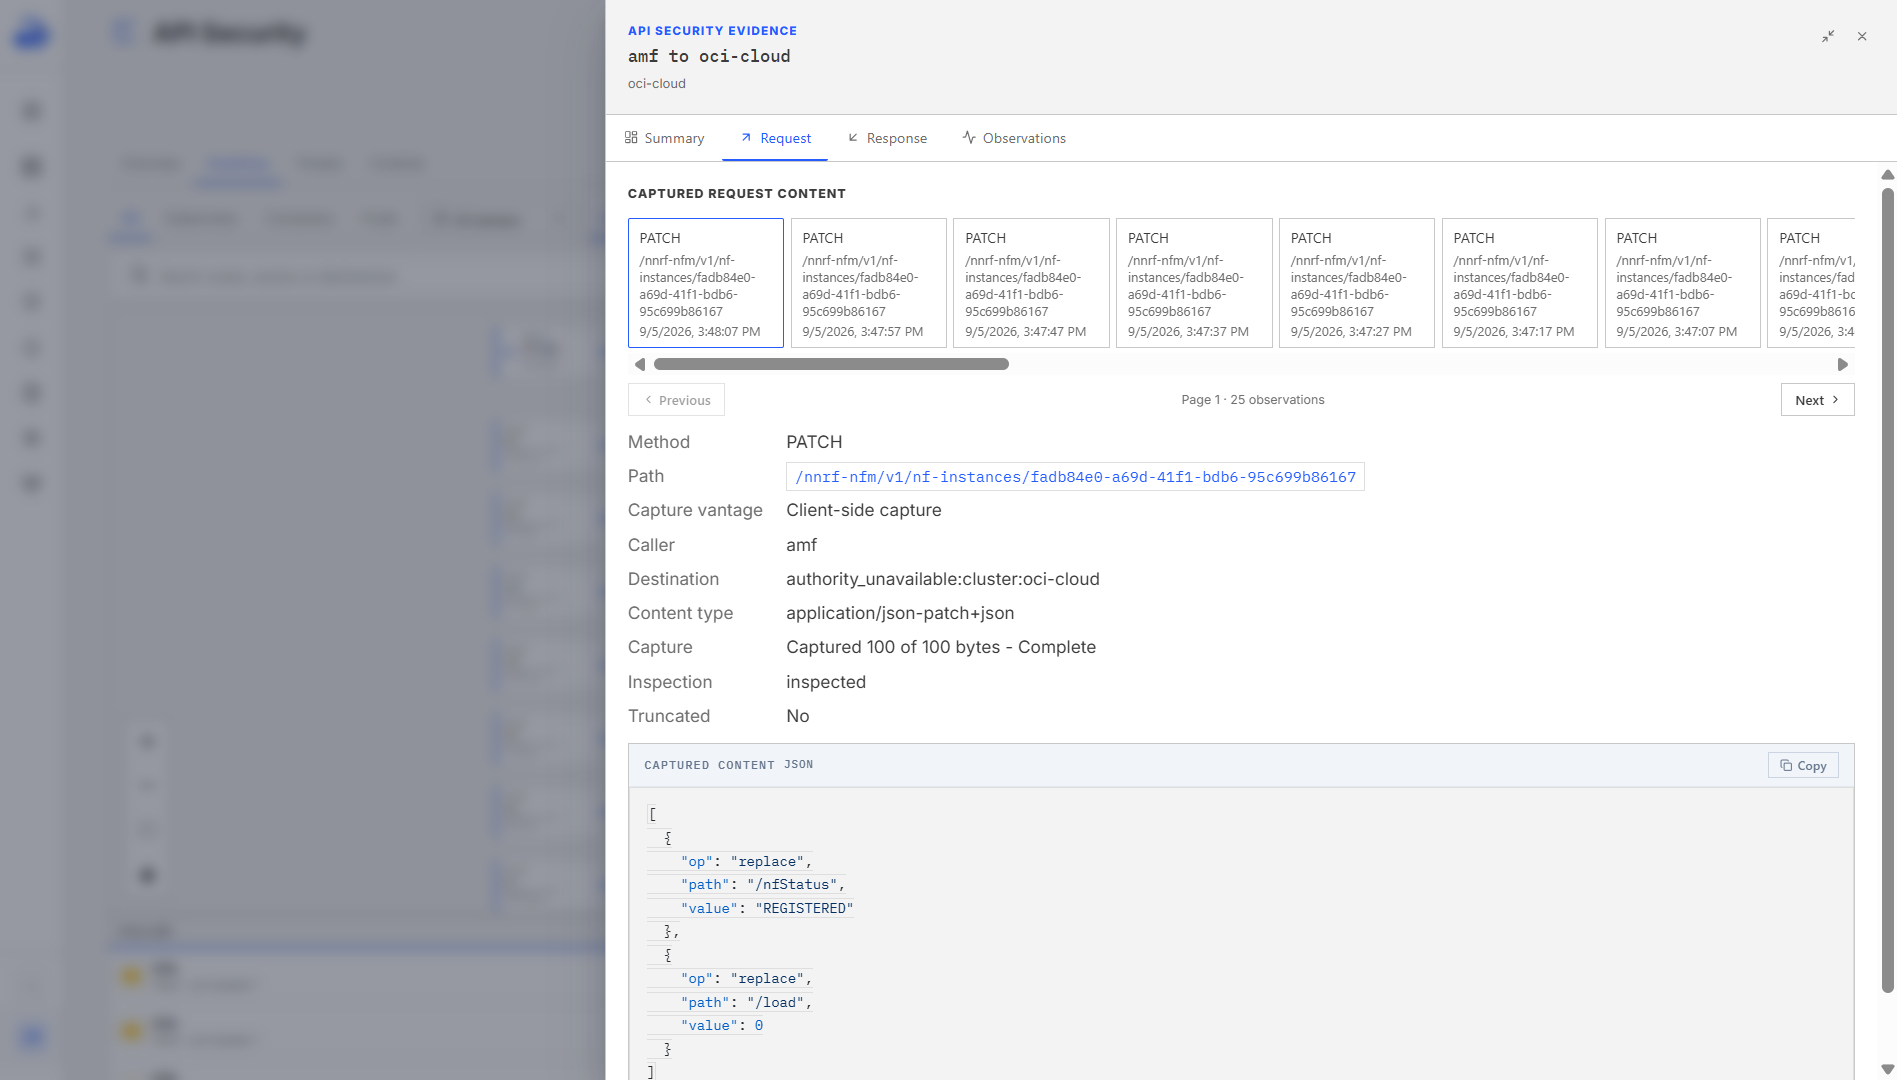
Select an endpoint, relationship, observation, or finding to open the expandable right-side panel. Available tabs depend on the evidence:
| Tab | What it shows |
|---|---|
| Summary | Endpoint identity, risk explanation, activity, caller-to-destination relationship, and available runtime context. |
| Request | Method, route, headers and body evidence that was captured for the selected observation. |
| Response | Status, latency, headers and body evidence available for the paired response. |
| Security | Findings, confidence, matched evidence, occurrences, and mitigation guidance. |
| Observations | Supporting observations and capture, pairing, decoding, and inspection details. |
Click a caller or destination in the relationship map, then select an observed relationship to inspect its traffic. Request and response observations load in pages; select the observation you need before reading its content. The same workflow is available in the Kubernetes-scoped API view.
Request and response body evidence is available only to Admin and Operator users. A body may be truncated, unavailable, or not observed even when endpoint metadata is complete. Use the displayed capture and inspection state when interpreting the result.
Use the panel pivots to continue in Runtime Explorer, Process Tree, Kubernetes workload details, sensor details, or Investigate without rebuilding the filter manually.
Call Trace
Call Trace is a contextual investigation tool opened from a relevant endpoint, observation, or finding. It orders related calls and shows the applications, workloads, processes, status, latency, time, and finding state for each observed hop.
Telovix distinguishes propagated trace context from inferred correlation. Missing hops are left missing; an inferred relationship is not presented as a propagated distributed trace.
Use Call Trace when you need to answer:
- Which upstream application initiated the request?
- Which services handled the request before the affected endpoint?
- Where did latency or an error first appear?
- Which process and workload produced each observed hop?
Controls
Controls has two subtabs.
Gateway Policies
Use Gateway Policies to review or manage API monitoring and enforcement controls. The current mode is shown explicitly. Creating, changing, enabling, disabling, or deleting a policy requires the appropriate Operator or Admin permission.
API Contracts
Use API Contracts to upload an approved OpenAPI contract, review a contract generated from observed traffic, and examine lifecycle or drift results.
| State | Meaning |
|---|---|
| Active | The API is observed and represented by the active contract. |
| New | The API was first observed in the selected comparison period. |
| Shadow | The API is observed but is not represented by an approved contract. |
| Orphan | A contract operation is not currently observed in runtime traffic. |
| Deprecated | The contract marks the operation as deprecated. |
| Drifted | Observed behavior differs from the approved contract. |
Contract upload and approval actions require a suitable scope and role. Select the relevant cluster or sensor before uploading when the Console requests it.
Visibility Health
Select Visibility Health in the page header to review whether the evidence supports your investigation. It summarizes response pairing, destination resolution, method decoding, body inspection, event loss, suppression, and sensor reporting health.
Common states include:
| State | Interpretation |
|---|---|
| Observed | The required evidence was captured for the selected period. |
| Metadata only | Endpoint metadata is available, but body evidence was not inspected. |
| Not observed | No matching evidence was seen in the selected scope and period. |
| Unsupported | The current protocol, encoding, or runtime path cannot provide that evidence. |
| Partial | Some evidence is available, but capture, pairing, or delivery loss occurred. |
| Unavailable | The Console cannot currently retrieve or evaluate the evidence. |
Operator and Admin users can open advanced per-sensor diagnostics. Material gaps are also shown on affected endpoints and findings.
Extended Capture
Extended Capture increases request and response evidence collection for a selected sensor. Use it only when normal evidence is insufficient for a focused investigation.
- Open the evidence panel or the AI and MCP lens and expand Extended Capture.
- Select the target sensor.
- Choose the capture duration.
- Review the resource-use warning and confirm activation.
- Return to the relevant endpoint or finding to inspect new observations.
- Stop the capture when the investigation is complete.
Extended Capture is per sensor. It does not enable fleet-wide capture. Operator and Admin roles can start or stop it, including an indefinite session where available. Longer sessions can increase resource use and evidence volume, so keep the scope as narrow as possible.
Troubleshooting
| Symptom | Check |
|---|---|
| No endpoints appear | Confirm the selected time range, platform and scope; then check Visibility Health and sensor status. |
| Kubernetes API Security is empty | Open the cluster from Kubernetes > Kubernetes Fleet, confirm Sensors belong to that cluster, and clear filters inherited from another scope. |
| Destination is unresolved | Open Runtime and Visibility evidence; verify the destination address or authority can be linked to a known service in the selected period. |
| Request or response body is absent | Check role, inspection outcome, truncation state, pairing status, content type, and whether Extended Capture was active for that sensor. |
| Call Trace has one hop | Confirm trace context was propagated or that enough evidence exists for an explicitly inferred relationship. |
| A finding looks incorrect | Open the exact Security evidence and highlighted request or response before marking it true or false positive. |