5G Core (AMF / SMF / UPF)
AMF, SMF, and UPF are the three 5G Core functions the telecom sensor monitors with role-specific protocol instrumentation, KPI tracking, and security checks.
Requires: Telecom sensor flavor. Deploy sensors with
flavor=telecomusing the Deploy Sensor wizard.
All three functions require the telecom sensor flavor. The node role (amf, smf, or upf) is set during enrollment in the Console enrollment wizard. If the role is not declared explicitly, the sensor uses port binding analysis to auto-detect and assign it.
AMF (Access and Mobility Management Function)
The AMF terminates the N2 interface from gNBs over NGAP (SCTP port 38412, PPID 60). It handles UE registration, session context setup, handovers, and NAS message relay. The sensor monitors the NGAP control plane on this interface directly.
NGAP procedure monitoring
The sensor decodes APER PDU headers and extracts information elements for these procedures:
| Procedure | Code | What the sensor captures |
|---|---|---|
| InitialUEMessage | 15 | UE context, NAS PDU, RAN-UE NGAP ID |
| DownlinkNASTransport | 11 | NAS PDU to UE |
| UplinkNASTransport | 46 | NAS PDU from UE |
| InitialContextSetup | 14 | Bearer setup success and failure |
| UEContextRelease | 41 | Teardown event and latency |
| HandoverPreparation | 12 | Handover success and failure |
| NGSetup | 21 | N2 interface setup and failure |
Procedure events appear in the runtime event stream as ngap_procedure events. The sensor records the gNB peer, procedure outcome, and timestamp.
NGAP KPIs
| KPI | Target | Alert condition |
|---|---|---|
| InitialContextSetupFailure rate | < 0.1% | Exceeded threshold per gNB |
| UEContextRelease teardown latency | Tracked | Spike or churn |
| Handover success rate | Tracked per AMF | Drop below baseline |
| NGSetup failure count | 0 | Any failure per gNB |
Too many InitialContextSetup failures from the same gNB indicate bearer setup failure or a potential signaling attack. NGSetup failures indicate the gNB cannot register with this AMF, which may reflect security filtering or connectivity loss.
SLO target
AMF has a five-nines (99.999%) availability target (3GPP TS 22.261). An SLO breach alert fires after the function has been observed for at least 300 seconds and availability falls below this target. Breach alerts are suppressed for 3,600 seconds to prevent storm conditions.
AMF security checks
- Privilege escalation: Any
setuidfrom the AMF process to UID 0 (root), or a UID crossing to a different NF type, fires an escalation alert. - Rogue child process: Any child process spawned by the AMF binary that falls outside the learned baseline fires a rogue process alert. The baseline is built over the learning window.
- Binary integrity: Hash comparison against the enrolled baseline. A mismatch fires a critical integrity alert.
- Mutable path execution: Execution from
/tmp,/dev/shm, or other writable paths fires immediately regardless of learning state. - SBI plaintext: If the AMF is observed serving
Namfover plaintext HTTP/2 on a SBI port (7777 or 29500-29599), the sensor fires a critical SBI compliance alert (3GPP TS 29.501 requires mTLS for SBI).
SMF (Session Management Function)
The SMF controls PFCP sessions with UPFs over the N4 interface (UDP port 8805). It also communicates with other core NFs over SBI (HTTP/2). The sensor monitors the PFCP control plane on N4 and the SBI caller graph.
PFCP session tracking
The sensor decodes the PFCP message header and extracts Session Establishment Data for each session:
- PDR (Packet Detection Rules): source interface, destination, precedence
- FAR (Forwarding Action Rules): forward, duplicate, or drop
- URR (Usage Reporting Rules): volume thresholds
Each session is tracked by its SEID (Session Endpoint Identifier), mapped to UE session context. Session state transitions are recorded: Created, Modified, Active, Deleted.
Quality of service parameters tracked per session:
- 5QI (5G QoS Indicator)
- AMBR (Aggregate Maximum Bitrate)
- Volume threshold (trigger for usage reports)
PFCP metrics
| Metric | SLO | Anomaly trigger |
|---|---|---|
| Session create latency (SMF to UPF) | < 100ms | Exceeded |
| Session modification rate per UPF | Baseline | Spike |
| Dropped packet count | 0 | Any drop |
PFCP anomalies
| Anomaly | Meaning |
|---|---|
| Invalid SEID | Packet referencing unknown session; potential spoofing or stale state |
| SEID collision | Duplicate session identifier; session hijacking risk |
| Session churn | Rapid create/delete cycling; may indicate attach storm or attack |
SBI caller matrix
The sensor builds a call graph of NF-to-NF SBI interactions. Expected SMF calls:
Nnrf-nfm: NRF discovery to find UPF instancesNpcf-smpolicycontrol: Policy retrieval from PCFNudm-sdm: Subscriber data from UDMNausf: AUSF authentication
Anomalies detected by the caller matrix:
| Anomaly | Severity | Meaning |
|---|---|---|
| SMF not calling NRF for UPF discovery | Warning | Configuration or network fault |
| Unexpected service call (e.g., SMF calling UDR directly) | Warning | Out-of-spec behavior |
| SBI request latency > 500ms | Warning | Congestion or downstream failure |
SMF SLO target
SMF carries a five-nines (99.999%) availability target. Same breach and suppression parameters as AMF apply.
SMF security checks
- Same privilege escalation, rogue child, binary integrity, and mutable path checks as AMF.
- SBI TLS posture:
Nsmfendpoints on SBI ports must use mTLS. Plaintext fires critical;OpaqueTls(TLS detected but no uprobe coverage) fires high.
UPF (User Plane Function)
The UPF terminates GTP-U tunnels from gNBs (N3, UDP 2152) and other UPFs (N9, UDP 2152), and the PFCP control channel from the SMF (N4, UDP 8805). The sensor monitors both planes simultaneously.
GTP-U tunnel inventory
The sensor tracks each tunnel by TEID (Tunnel Endpoint Identifier). The TEID uniquely identifies a UE data plane tunnel on this UPF. The sensor records:
- TEID value and mapped UE session
- Inner PDU payload type (IPv4 or IPv6)
- Endpoint role: N3 (from gNB), N9 (from peer UPF), or S1-U (4G SGW)
In the Console, go to Telco > User Plane. Select the target sensor from the node list to view its GTP-U tunnel inventory.
GTP-U anomalies
| Anomaly | Meaning |
|---|---|
| TEID Reuse | Same TEID used by different PDN connections; session hijacking risk |
| Out-of-Order Packets | Sequence number gaps; congestion or packet reordering attack |
| Invalid TEID | Packet with TEID not in session table; routing error or spoofing |
| Encapsulation Loop | GTP-U packet containing another GTP-U packet; stack overflow attack |
| Payload Size Anomaly | Inner packet exceeds tunnel MTU; fragmentation bypass attempt |
Visibility gap detection
High-performance UPF deployments often use kernel bypass networking (AF_XDP, VFIO, DPDK) to avoid the standard packet path. When the sensor detects one of these techniques on GTP-U port 2152, it sets gtp_visibility_gap=true in the heartbeat and the Console displays a warning:
User plane traffic not visible to eBPF monitoring
The sensor checks:
/proc/{pid}/mapsforxdp_*entries (AF_XDP)/sys/bus/pciIOMMU group links (VFIO)/proc/meminfohugepage allocations (DPDK)
A visibility gap does not disable monitoring. Runtime events (process execution, file access, network connections) and PFCP control plane data remain fully visible. Only the GTP-U data plane packets are not accessible to the eBPF engine.
UPF PFCP context
The UPF receives PFCP Session Establishment and Modification requests from the SMF. The sensor tracks the same session state and metrics as described in the SMF section above, from the UPF perspective. Specifically:
- Session count per UPF (tracks scale)
- Session modification rate (operational load)
- Invalid SEID alerts (N4 integrity)
UPF SLO target
UPF carries a five-nines (99.999%) availability target as a user-plane critical function.
UPF security checks
Same privilege escalation, rogue child, binary integrity, and mutable path checks as AMF and SMF. The UPF has no SBI exposure by default, but if an SBI listener is observed on a UPF, the sensor flags it as an architectural anomaly.
NF resource metrics
All three functions report per-role resource data in the heartbeat:
| Metric | Reported |
|---|---|
| CPU usage (%) | Yes, per NF role |
| Memory (RSS, bytes) | Yes |
| Network interface throughput | Yes (N3, N4 interfaces) |
| Power estimate | Yes (per role, hourly aggregated) |
Resource history is available in the Console under the NF resource history panel, with hourly granularity.
Console views for 5G Core
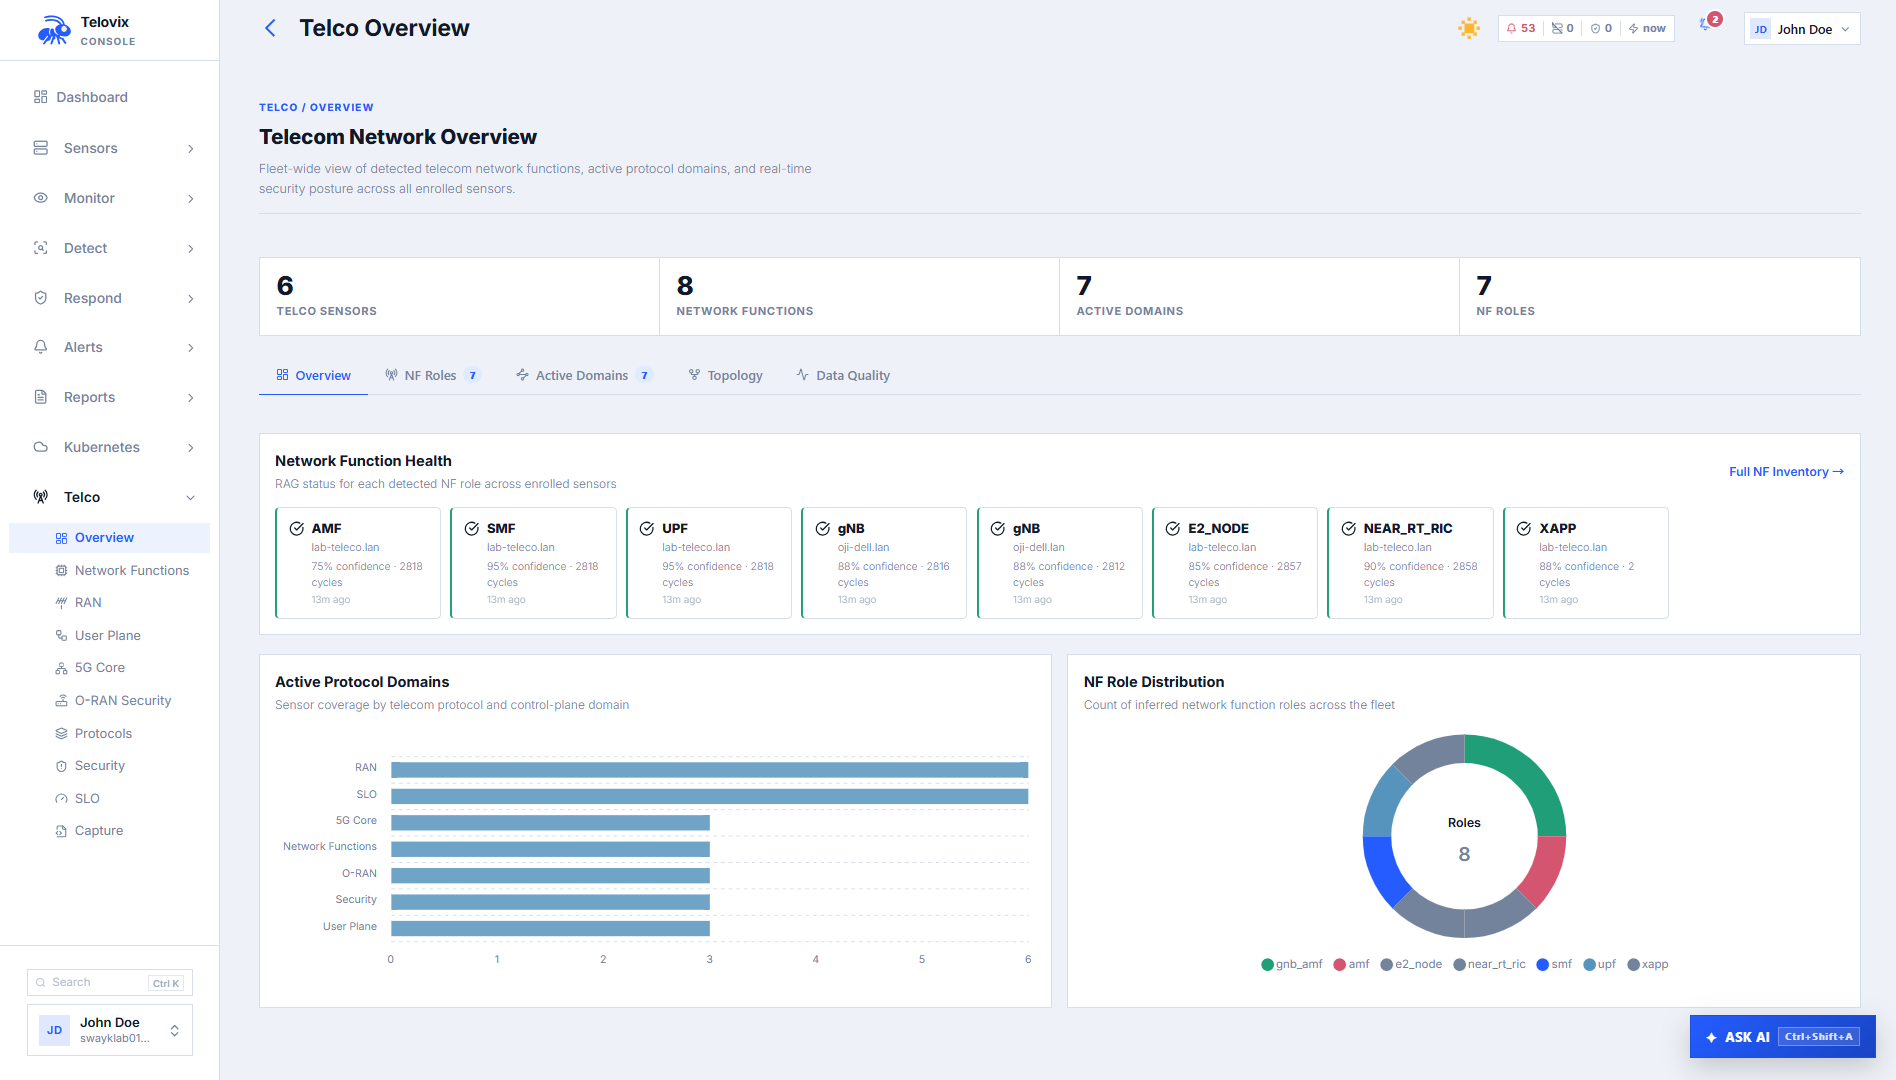
5G Core view
In the Console, go to Telco > 5G Core. The page shows the current NF inventory for AMF, SMF, and UPF roles across the fleet: role, sensor, confidence score, active interfaces, SLO status, and current anomaly risk level.
NF inventory
In the Console, go to Telco > NF Inventory. The list shows all detected network function roles across enrolled sensors. Use the role filter at the top of the list to scope the view to a specific role such as SMF.
NGAP KPIs (AI assistant)
Ask the AI assistant: "Show NGAP KPIs for the last hour."
The AI assistant get_ngap_kpis tool queries procedure success rates and durations from the ngap_kpi_history table. The get_pfcp_sessions tool returns the current PFCP session state per sensor. The get_gtpu_tunnels tool returns the GTP-U tunnel inventory.
SLO status
In the Console, go to Telco > SLO. The dashboard shows SLO availability per role per sensor, MTTR (mean time to repair from the last 10 recovery samples), and current breach state.
Telecom security events
In the Console, go to Telco > Security. The list shows security findings specific to telecom NF roles: protocol violations, privilege escalation, rogue processes, integrity failures, and visibility gaps. Use the NF role filter to scope results to a specific role such as UPF.
Operational guidance
Role assignment: Declare the role explicitly during enrollment (see the Console enrollment wizard). Auto-detection from port bindings works but adds latency before KPIs and SLO tracking become active. Explicit assignment takes effect from the first heartbeat.
Monitoring interface: The monitoring interface is configured in Console Settings under the sensor configuration. The sensor auto-detects by analyzing telecom socket bindings, then falls back to the default route interface, then to the first physical interface, then to eth0. Override this when the auto-detection picks the wrong interface.
Kernel bypass UPF: If the UPF uses AF_XDP or DPDK, the sensor will report a GTP-U visibility gap. This is expected. The PFCP control plane remains fully monitored. Set a suppression rule on gtp_visibility_gap events for production UPFs running kernel bypass networking to avoid repeated low-value alerts.
SBI TLS: All three functions should use mTLS on SBI interfaces. If the Console reports SBI_PLAINTEXT or SBI_OPAQUE_TLS findings, resolve the TLS configuration before enabling enforcement mode on these nodes. Enforcement containment on an AMF or SMF with degraded TLS coverage will reduce the fidelity of SBI call monitoring.
Learning window: The sensor requires approximately 300 seconds of observation before SLO breach alerts activate and before the behavioral baseline is stable enough for rogue process alerts. During this window, informational anomaly events still appear but are not escalated to breach status.
Further reading
- User Plane (GTP-U / PFCP)
- RAN Signaling (NGAP / F1AP / E2AP)
- SLO and Resource Monitoring
- Telecom Overview
- TLS Uprobe Coverage
- O-RAN WG11 Compliance
- 3GPP TS 38.413 - NG Application Protocol (NGAP)
- 3GPP TS 29.244 - Interface between the Control Plane and the User Plane nodes (PFCP)
- 3GPP TS 29.281 - General Packet Radio System (GPRS) Tunnelling Protocol User Plane (GTPv1-U)
- 3GPP TS 29.501 - 5G System Principles; Stage 3 (SBI)